Clams experience mortality due to temperature extremes, other causes
not directly modeled, hypoxia, and crab predation. This section
focuses on the first three while crab predation is discussed in
Appendix A.5.6. Mortality due to the first three
causes is updated every 24 hours (along with all the environmental
variables) while the effects of crab predation on the number of clams
in each age class are applied as the crabs forage. The cumulative
proportion of clams dieing from the first three causes over ![]() is the sum of the probabilities resulting from
Eqns (A.20) and (A.21).
is the sum of the probabilities resulting from
Eqns (A.20) and (A.21).
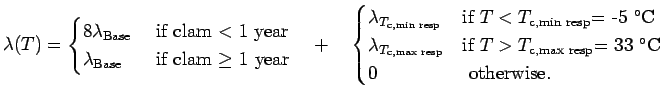
Mortality caused by temperature extremes and other causes (which in the parameterization below includes predation by fishes and other non-crab estuarine organisms) are modeled according to an exponential probability distribution (van der Meer et al. 2001) with hazard rate:
The thermal tolerance of clams can be as low -5
![]() (Bourget 1983) and as high as
(Bourget 1983) and as high as  35
35
![]() (Wilson 1981). Kennedy and Mihursky (1971) found LC50 values of
(Wilson 1981). Kennedy and Mihursky (1971) found LC50 values of
![]() and that an increase of 1
and that an increase of 1
![]() could mean
the difference between 0% and 100% mortality. In the above hazard
rate, if the temperature is less than
could mean
the difference between 0% and 100% mortality. In the above hazard
rate, if the temperature is less than
![]() C clams, survive on average for 2 hours and if temperature is
greater than
C clams, survive on average for 2 hours and if temperature is
greater than
![]() they survive on average for 4
days.
they survive on average for 4
days.
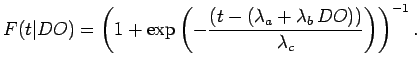
Hypoxic exposure can also cause clam mortality. In the Calvert Cliffs region of Chesapeake Bay, hypoxia is severe enough that near total faunal depletion (molluscs, annelids, crustacea) occurs during the summer months due to low dissolved oxygen (Holland et al. 1977; Holland et al. 1987). Buzzelli et al. (2002) estimated that in the Neuse the clams Macoma balthica and M. mitchelli, which are the biomass dominants in the benthic assemblage, declined by 90-100% over 38% of the estuary in 1997. To model clam mortality due to hypoxic exposure, we use the logistic cumulative probability distribution function of times-to-death for a given fixed DO exposure (Borsuk et al. 2002):
 is the duration of hypoxia in hours. We are not aware of
any studies examining how survival probabilities are altered by
temperature or exposure to periodic hypoxic conditions. We assume
that no clams will die at DO
is the duration of hypoxia in hours. We are not aware of
any studies examining how survival probabilities are altered by
temperature or exposure to periodic hypoxic conditions. We assume
that no clams will die at DO