Ecological Archives E096-238-A2
Adam T. Ford, Jacob R. Goheen, David J. Augustine, Margaret F. Kinnaird, Timothy G. Obrien, Todd M. Palmer, Robert M. Pringle, and Rosie Woodroffe. 2015. Recovery of African wild dogs suppresses prey but does not trigger a trophic cascade. Ecology 96:27052714. http://dx.doi.org/10.1890/14-2056.1
Appendix B. Supplementary results showing the distribution of wild dogs before and after denning, rainfall since 1998, change in stem density for 4 groups of tree species in experiments established before and after wild dog recovery, model selection results for factors affecting dik-dik abundance, and the abundance of dominant ungulate species before and after wild dog recovery.
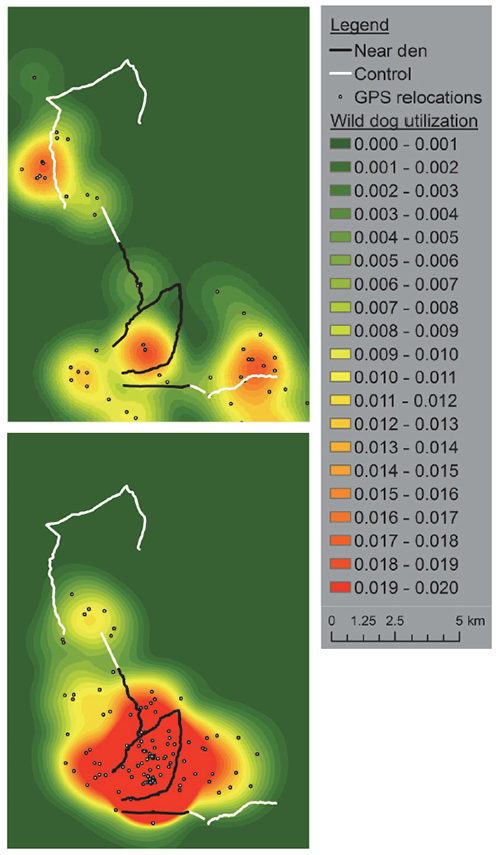
Fig. B1. Location of transects near and away from an active wild-dog denning site. The top-panel shows wild dog utilization during the pre-denning period (Sep–Nov 2011) while the bottom panel shows the same area during the active denning period (Dec 2011–Jan 2012). White lines are control road transects and black lines are the ‘near den’ (i.e., inside the denning home range) transects. We used a length weighted mean utilization of 0.005 to partition the denning home range and control areas. Points show GPS relocations (30 min interval) of a single adult female from this pack during the crepuscular hunting period. There are no GPS relocations available in the post-denning period but tracking VHF collars fitted to other members of the same pack confirmed that the den was not being used during this time.
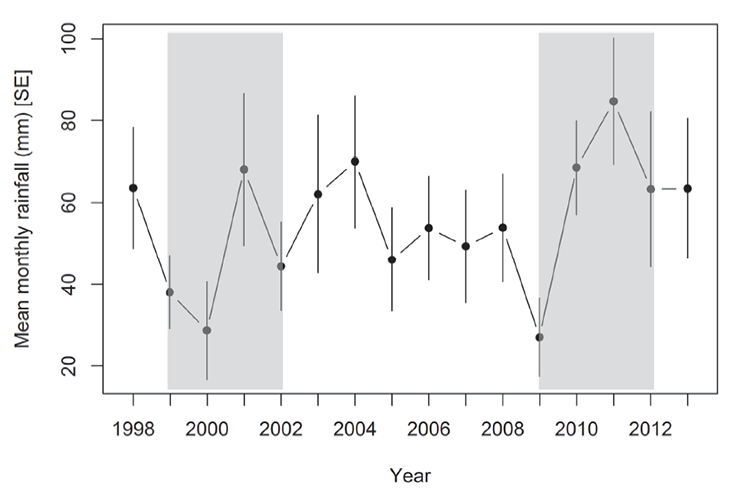
Fig. B2. Monthly rainfall during each year of this study. Wild dogs recolonized the area in 2002 and began denning on Mpala Research Centre in 2003. Shaded sections show the years during which the two herbivore exclosure experiments were conducted. We estimated dik-dik abundance in 1999–2002 and from 2008-onwards.
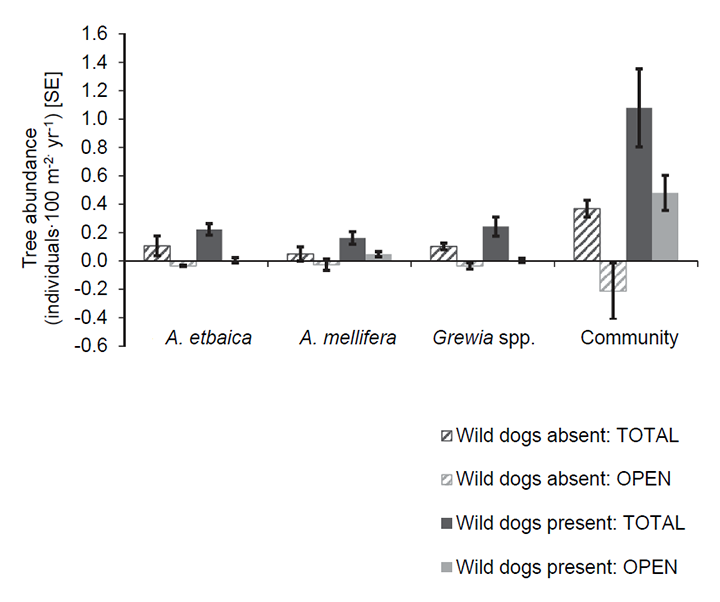
Fig. B3. The effect of wild dog recovery and ungulate exclusion on tree abundance, measured as the net rate of change in density (individuals 100 m-2 yr-1) for trees in the 1–2 m height class, over a 3-year period pre- (1999–2002, n = 3 pairs of plots) and post- (2009–2012, n = 6 pairs of plots) wild dog recovery. Treatments were either TOTAL (no access to ungulates) or OPEN (accessible to all ungulates). “Community” includes the aggregate response of 32 species of trees and woody plants.
Table B1. Model selection table for the effects of dik-dik abundance (DENSITY = individuals km‑2), rainfall (RAIN = mm∙6 mo-1), the estimated consumption of dik-dik by wild dogs prior to dik-dik population surveys (EATEN = individuals∙km‑2) and an interaction between EATEN and DENSITY and RAIN and DENSITY on dik-dik population growth (rd) between surveys. K refers to the number of parameters in the model.
Model |
K |
Log-likelihood |
AICc |
Δ AICc |
Akaike weight (wi) |
EATEN |
6 |
-66.66 |
155.83 |
0.00 |
0.92 |
EATEN + RAIN |
7 |
-66.06 |
162.12 |
6.29 |
0.04 |
EATEN + DENSITY |
7 |
-66.66 |
163.33 |
7.50 |
0.02 |
RAIN |
6 |
-71.29 |
165.08 |
9.25 |
0.01 |
DENSITY |
6 |
-71.45 |
165.41 |
9.58 |
0.01 |
EATEN + RAIN + EATEN × RAIN |
8 |
-65.62 |
171.24 |
15.41 |
<0.01 |
DENSITY + RAIN |
7 |
-74.12 |
178.23 |
22.40 |
<0.01 |
EATEN + DENSITY + EATEN × DENSITY |
8 |
-73.30 |
186.60 |
30.77 |
<0.01 |
EATEN + DENSITY + RAIN |
8 |
-74.35 |
188.70 |
32.87 |
<0.01 |
EATEN + DENSITY + RAIN + EATEN × DENSITY |
9 |
-69.59 |
193.17 |
37.34 |
<0.01 |
EATEN + DENSITY + RAIN + EATEN × RAIN |
9 |
-71.42 |
196.83 |
41.00 |
<0.01 |
EATEN + DENSITY + RAIN + EATEN × DENSITY + EATEN × RAIN |
10 |
-62.17 |
199.34 |
43.51 |
<0.01 |
Table B2. Model selection table for the effects of ungulate exclusion treatment (OPEN vs. TOTAL exclusion) and the status of wild dog recovery (pre- vs. post-wild dog recovery) on tree abundance, measured as the net difference in stem density (individuals ∙100 m-2∙yr-1). “Community” includes the aggregate response of 32 species of trees and woody plants. K refers to the number of parameters in the model.
| Species | Model | K | Log-likelihood | AICc | ΔAICc | Akaike weight (wi) |
Community |
Treatment + Recovery |
7 |
-3.65 |
32.51 |
0.00 |
0.75 |
Recovery |
6 |
-7.97 |
35.57 |
3.06 |
0.16 |
|
Treatment |
6 |
-9.00 |
37.63 |
5.12 |
0.06 |
|
Treatment + Recovery + Treatment × Recovery |
8 |
-3.65 |
39.30 |
6.80 |
0.03 |
|
A. etbaica |
Treatment |
6 |
26.99 |
-34.33 |
0.00 |
0.56 |
Treatment + Recovery |
7 |
29.47 |
-33.74 |
0.59 |
0.41 |
|
Treatment + Recovery + Treatment × Recovery |
8 |
30.00 |
-28.00 |
6.33 |
0.02 |
|
Recovery |
6 |
22.62 |
-25.61 |
8.72 |
0.01 |
|
A. mellifera |
Treatment + Recovery |
7 |
24.07 |
-22.94 |
0.00 |
0.37 |
Treatment |
6 |
21.29 |
-22.94 |
0.00 |
0.37 |
|
Recovery |
6 |
20.89 |
-22.14 |
0.80 |
0.25 |
|
Treatment + Recovery + Treatment × Recovery |
8 |
24.23 |
-16.46 |
6.48 |
0.01 |
|
Grewia spp. |
Treatment |
6 |
23.96 |
-28.29 |
0.00 |
0.67 |
Treatment + Recovery |
7 |
25.95 |
-26.71 |
1.58 |
0.30 |
|
Treatment + Recovery + Treatment × Recovery |
8 |
26.94 |
-21.88 |
6.40 |
0.03 |
|
Recovery |
6 |
18.75 |
-17.86 |
10.43 |
<0.01 |
Table B3. Changes in the energetic demand of browsers at Mpala Research Centre pre- (1999–2002) and post- (2008–2011) recovery of wild dogs. Population densities were determined using distance sampling methods, described in Appendix A.
|
|
|
Density |
Biomass density |
Energetic demand |
|||||||||
Species |
Mass (kg) |
Residency |
Pre- |
Post- |
Pre- |
Post- |
Pre- |
Post- |
||||||
Dik-dik |
5 |
Resident |
139.00 |
109.00 |
694 |
546 |
93406 |
78359 |
||||||
Steinbuck |
10 |
Resident |
0.52 |
0.10* |
5 |
1 |
2574 |
767 |
||||||
Thompson's gazelle |
25 |
Resident |
0.00 |
0.04* |
0 |
4 |
0 |
2123 |
||||||
Bushbuck |
30 |
Resident |
0.20 |
0.10* |
6 |
3 |
2859 |
1719 |
||||||
Impala |
40 |
Resident |
20.30 |
23.30 |
812 |
932 |
104872 |
116037 |
||||||
Grant's gazelle |
50 |
Resident |
0.00 |
1.35 |
0 |
68 |
0 |
16895 |
||||||
Eland |
340 |
Resident |
0.37 |
0.39 |
126 |
133 |
26682 |
27733 |
||||||
Giraffe |
750 |
Migrant |
0.33 |
1.56 |
248 |
1170 |
43846 |
137118 |
||||||
Elephant |
1725 |
Migrant |
1.70 |
0.98 |
2933 |
1691 |
269153 |
179643 |
||||||
All browsers |
162 |
137 |
4823 |
4547 |
543392 |
560395 |
||||||||
Resident-only |
160 |
135 |
1643 |
1686 |
230393 |
243634 |
||||||||
* Due to low detection, these estimates are at the limit of resolution.