Appendix D. Figures showing the distribution of isolation and density of individual Echinacea plants in the preserve compared to those in surrounding remnants.
|
|
|
|
|
|
|
|
|
|
|
|
|
|
|
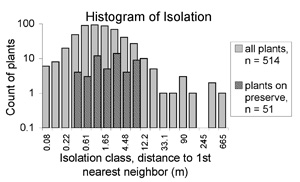
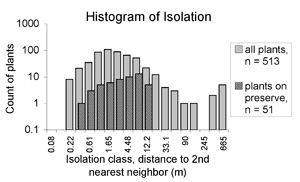
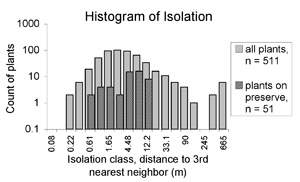
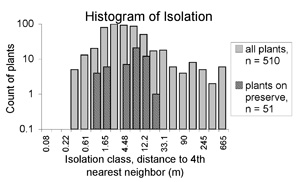
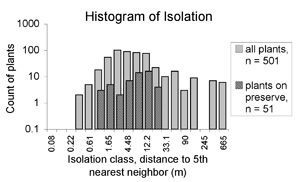
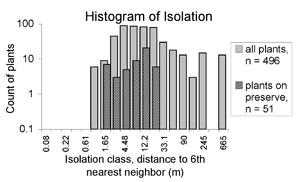
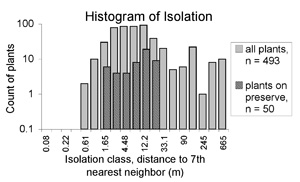
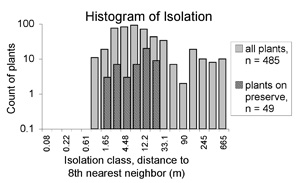
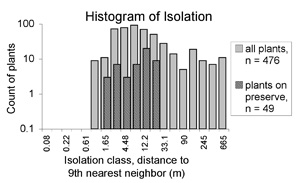
| FIG. D1. The distributions of isolation (the distance to the kth-closest flowering conspecific at nine scales, n = 1–9) for individual flowering Echinacea plants in the preserve compared to those in surrounding remnants in 1998. There were 51 plants on the preserve transect and 514 from surrounding remnants, but as the numbers of neighbors under consideration increased, the least proximate plants became unmapped or off-site, and therefore at an imprecisely known distance from the focal plant; plants with such neighbors were excluded from analyses. Note that all axes are on a logarithmic scale. | |

|
|
|
|
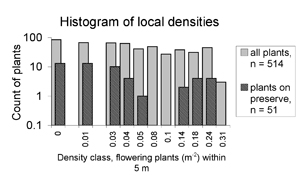
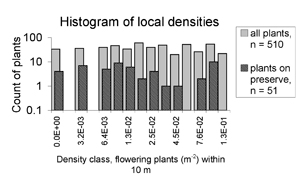
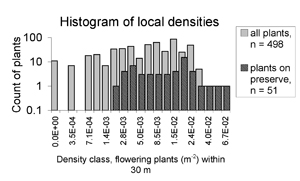
| FIG. D2. The distribution of density of individual Echinacea plants in the preserve compared to those in surrounding remnants within the 6400 ha study area in 1998. Density of flowering individuals is defined within x m, for x = 1, 5, 10, and 30. There were 51 plants on the preserve transect and 514 sampled from surrounding remnants, but for four and 16 of the 514 plants we did not have a count of all plants within 10 and 30 m, respectively. Note that all axes are on a logarithmic scale. The first five density classes correspond to counts of 0, 1, 2, 3, and 4 individuals. | |