Appendix C. Estimation of ![]() .
.
We chose three values of lateral diffusion of pollen, corresponding to the degree of atmospheric stability: stable ![]() = 5°, medium
= 5°, medium ![]() = 13° and highly unstable
= 13° and highly unstable ![]() =19°. These values are in the range of observed values found in the studies reviewed below.
=19°. These values are in the range of observed values found in the studies reviewed below.
In a review of wind pollination, McCartney and Fitt (1985) cite values of ![]() from Briggs (1974);
from Briggs (1974);
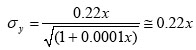 , i.e.
 ![]() = 13°, for Pasquill atmospheric stability class A (highly unstable) (Pasquill 1974).
= 13°, for Pasquill atmospheric stability class A (highly unstable) (Pasquill 1974).
![]() , i.e.
, i.e. ![]() = 9°, for class B (unstable),
= 9°, for class B (unstable),
 , i.e.
 ![]() = 6°, for class C (slightly unstable), and
= 6°, for class C (slightly unstable), and
![]() , i.e.
, i.e. ![]() = 5°, for class D (neutral).
= 5°, for class D (neutral).
Atmospheric stability classes A to D are the only classes that occur during the daytime, the time when pollen is released.
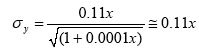
In a recent comprehensive model of wind dispersal of oilseed rape pollen, Hunt et al. (2001) assumed ![]() = 0.10x, presumably based on their observation that the atmosphere in the UK is usually near-neutral. Furthermore, McCartney and Lacey (1991) assumed neutral atmospheric stability in their modeling of the dispersal of oilseed rape pollen.
= 0.10x, presumably based on their observation that the atmosphere in the UK is usually near-neutral. Furthermore, McCartney and Lacey (1991) assumed neutral atmospheric stability in their modeling of the dispersal of oilseed rape pollen.
Moore (1969) measured dispersion of pollutants from chimneys, and concluded that ![]() = 0.08x, which included the hourly variation in wind direction.
= 0.08x, which included the hourly variation in wind direction. ![]() tended to decrease with increasing wind speed. See Appendix G for a discussion of the effect of the period of observation on the degree of lateral spread.
tended to decrease with increasing wind speed. See Appendix G for a discussion of the effect of the period of observation on the degree of lateral spread.
As far as we are aware, there are just two empirical studies of the lateral spread of pollen (Raynor et al. 1970, Raynor et al. 1972). Raynor et al. (1970) estimated ![]() for ragweed pollen, based on pollen emitted from a point source and from plots of ragweed ranging in diameter from 5.5 to 27.4 m. They measured
for ragweed pollen, based on pollen emitted from a point source and from plots of ragweed ranging in diameter from 5.5 to 27.4 m. They measured ![]() at the greatest distance from the point source (60 m) as approximately 21 m, giving
at the greatest distance from the point source (60 m) as approximately 21 m, giving ![]() = tan-1(21/60) = 0.34 radians = 19°.
= tan-1(21/60) = 0.34 radians = 19°. ![]() at the greatest distance (on average approximately 70 m) from the center (not the edge as published) of the plots was approximately 30 m, giving
at the greatest distance (on average approximately 70 m) from the center (not the edge as published) of the plots was approximately 30 m, giving ![]() = tan-1(30/70) = 0.40 radians = 23°.
= tan-1(30/70) = 0.40 radians = 23°.
The estimates of ![]() from Raynor et al. (1970) and Raynor et al. (1972) should be treated with some caution. First, atmospheric conditions were unstable during the tests, which would tend to inflate
from Raynor et al. (1970) and Raynor et al. (1972) should be treated with some caution. First, atmospheric conditions were unstable during the tests, which would tend to inflate ![]() . Second, the point source tests were performed over a short period of time (< 1 hour), which should give an accurate estimate of
. Second, the point source tests were performed over a short period of time (< 1 hour), which should give an accurate estimate of ![]() . However, the plot tests lasted 3 hours or more. Although the tests were ended if there were any significant changes in meteorological conditions (such as wind direction), the estimate of
. However, the plot tests lasted 3 hours or more. Although the tests were ended if there were any significant changes in meteorological conditions (such as wind direction), the estimate of ![]() would probably include a substantial component due to variability of wind direction (Appendix G). This would tend to inflate
would probably include a substantial component due to variability of wind direction (Appendix G). This would tend to inflate ![]() for the plot tests. Finally, in the calculation of
for the plot tests. Finally, in the calculation of ![]() from the source plots, no allowance was made for the width of the source. This would again inflate
from the source plots, no allowance was made for the width of the source. This would again inflate ![]() for the plot tests.
for the plot tests.
Raynor et al. (1972) performed similar tests to estimate ![]() for corn. In this case, there were no point sources. Instead, they used source plots of diameter 18 m. In 1963,
for corn. In this case, there were no point sources. Instead, they used source plots of diameter 18 m. In 1963, ![]() at the greatest distance from the center (not the edge as published) of the plots (39 m) was approximately 10 m, giving s q = tan -1(10/39) = 0.25 radians = 14°. In 1964, s y at the greatest distance from the centre of the plots (69m) was approximately 15m, giving
at the greatest distance from the center (not the edge as published) of the plots (39 m) was approximately 10 m, giving s q = tan -1(10/39) = 0.25 radians = 14°. In 1964, s y at the greatest distance from the centre of the plots (69m) was approximately 15m, giving ![]() = tan-1(15/69) = 0.21 radians = 12°. However, the tests lasted from 1.5 to 9 hours. Although the tests were ended if there were any significant changes in meteorological conditions (as Raynor et al. 1970), this would tend to inflate
= tan-1(15/69) = 0.21 radians = 12°. However, the tests lasted from 1.5 to 9 hours. Although the tests were ended if there were any significant changes in meteorological conditions (as Raynor et al. 1970), this would tend to inflate ![]() . The calculations of s y again made no allowance for the width of the source plots. This would again inflate
. The calculations of s y again made no allowance for the width of the source plots. This would again inflate ![]() .
.
Based on the evidence above, we chose three values of lateral diffusion for the purposes of modelling: ![]() = 5°, 13°, and 19°. The low and medium values corresponded to atmospheric stability classes D (neutral) and A (highly unstable). The high value corresponded to the measurement of Raynor et al. (1970) for the lateral dispersion of ragweed pollen from a point source. In our opinion, this was the value least likely to suffer from the inaccuracies mentioned above.
= 5°, 13°, and 19°. The low and medium values corresponded to atmospheric stability classes D (neutral) and A (highly unstable). The high value corresponded to the measurement of Raynor et al. (1970) for the lateral dispersion of ragweed pollen from a point source. In our opinion, this was the value least likely to suffer from the inaccuracies mentioned above.
As mentioned above, we assumed that s q was independent of the crop. The inertia of relatively heavy pollen (e.g., maize) is greater than the inertia of relatively light pollen (e.g., oilseed rape). Hence lateral diffusion might be less for relatively heavy compared to relatively light pollen and gases (Raynor et al. 1972). Nevertheless, we and other workers (Prof. A. McCartney, personal communication) believe that any difference in lateral diffusion is small. Furthermore, relative cross-pollination rates are relatively insensitive to the degree of lateral diffusion, when compared to differences in field geometry (Fig. 2, main text).
LITERATURE CITED
Briggs, G. A. 1974. Environmental Research Laboratories, Air Resources Atmospheric Turbulence and Diffusion Laboratory 1973 Annual Report. U.S Atomic Energy Comm. Rep. ATDL-106. National Oceanic and Atmospheric Administration. Washington, D.C., USA.
Hunt, J. C. R., H. L. Higson, P. J. Walklate, and J. B. Sweet. 2001. Modelling the dispersion and cross-fertilisation of pollen from GM crops. Report to Department for Environment, Food and Rural Affairs.
McCartney, H. A., and B. D. L. Fitt. 1985. Mathematical Modelling of Crop Disease. Pages 107–143 in C. A. Gilligan, editor. Advances in Plant Pathology, Vol. 3. London: Academic Press, London, UK.
McCartney, H. A., and M. E. Lacey. 1991. Wind dispersal of pollen from crops of oilseed rape (Brassica napus L.). Journal of Aerosol Science 22:467–477.
Moore, R. J. 1969. The distribution of surface concentrations of sulphur dioxide emitted from a tall chimney. Philosophical Transactions of the Royal Society of London, Series A 265:245.
Pasquill, F. 1974. Atmospheric Diffusion. 2nd Edition. Ellis Horwood Ltd, Chichester, UK.
Raynor, G. S., E. C. Ogden, and J. V. Hayes. 1970. Dispersion and deposition of ragweed pollen from experimental sources. Journal of Applied Meteorology 9:885–895.
Raynor, G. S., E. C. Ogden, and J. V. Hayes. 1972. Dispersion and deposition of corn pollen from experimental sources. Agronomy Journal 64:420–427.