INTRODUCTION
Identifying the attributes of streamflow required to sustain aquatic ecosystems is critical to developing goals for riverine management or restoration (Richter et al. 1997, Arthington et al. 2006). Riverine biota have evolved in the context of a "natural flow regime" – the quantity, timing, and variability of flow unaffected by human influences over many years – and quantifying that flow regime is important for maintaining ecosystem function and natural biodiversity (Richter et al. 1996, Poff et al. 1997, Poff et al. 2009). Knowledge of the natural flow regime would facilitate assessment of which hydrologic attributes have been altered by humans in a particular stream and the establishment of specific goals for streamflow restoration (Richter et al., 1997). To that end, stream gage-specific expectations or benchmarks for specific hydrologic indicators (e.g., magnitude, frequency, duration, or timing of high and low flows) are desirable for the study and management of river ecology.
Data describing streamflow characteristics are obtained primarily from stream gages, which record the flow of the river at predetermined intervals from minutes to hours on a daily basis. Knowing the characteristics of natural streamflow for any specific stream or river is in most cases not possible because most streams are either ungaged or have been altered by human influences. The natural flow regime must therefore usually be estimated. A viable approach for quantifying the natural flow regime for a particular place is by considering data from nearby or regional gaged locations of reference quality: i.e., stream gages whose watersheds are least disturbed for a particular region (Vogel et al. 1999).
There are at least two requirements for designing a reference stream gage data set for predicting natural flow regimes. First, we need a population of sites having adequate long-term streamflow data from watersheds primarily influenced only by natural processes (e.g., climate, topography). Second, this population of reference stream gages should encompass a wide range of natural conditions (e.g., watershed size) in order to maximize the generality of model predictions.
Natural flow has been modeled or estimated at various scales in the United States (Thomas and Benson 1970, Orsborn 1974, Wallis et al. 1991, Vogel et al. 1999, Holmes et al. 2002, Sanborn and Bledsoe 2006, Carlisle et al. 2009). Several older national-scale data sets include stream gages or streamflow records which had been screened for minimal human influence (Wallis et al. 1991, Slack and Landwehr 1992, Poff 1996); however, they were derived before easy access existed to comprehensive digital geospatial data (e.g., high-resolution imagery, 30-m land cover data, national streamline data set, national dams database). The most comprehensive of these national data sets is the United States Geological Survey’s (USGS) hydro-climatic data network (HCDN; Slack and Landwehr 1992). The HCDN, whose data evaluation ended with water year 1988, identifies stream gages which at some point in their history had periods which represented natural flow, and the years in which those natural flows occurred were identified (Slack and Landwehr 1992). The HCDN watersheds remain a valuable source of historic streamflow data. Because technology and databases have evolved considerably since the late 1980s, however, we believe the identification of streams and rivers in the United States that currently have near-natural flow conditions would be a valuable addition. Most importantly, there is a critical need to publish a comprehensive set of geospatial characteristics of gaged watersheds so that the research community and public can use these data for a variety of purposes.
A. Data set identity: GAGES (Geospatial Attributes of Gages for Evaluating Streamflow): A stream gage database for evaluating natural and altered flow conditions in the conterminous United States.
B. Data set identification code: gages_basinchar_sept3_09.zip
C. Data set description:
gages_basinchar_sept3_09.zip. Zipped file containing 25 tab-delimited ASCII text files, representing watershed and site characteristics, one ASCII tab-delimited text file containing variable descriptions, and one MS Excel spreadsheet showing the hydrologic disturbance index score calculation.
Each of the 25 text data files contain 6,785 records, one for each stream gage, identified in each file by the unique identifier "GAGE_ID". The 25 files are: basinid.txt, bas_classif.txt, bas_morph.txt, census_block.txt, census_county.txt, climate.txt, geology.txt, hydro.txt, hydromod_dams.txt, hydromod_other.txt, infrastructure.txt, landscape_pat.txt, lc01_basin.txt, lc_change92_01.txt, lc01_mains100.txt, lc01_mains800.txt, lc01_rip100.txt, lc01_rip800.txt, nutrient_app.txt, pest_app.txt, prot_areas.txt, reach.txt, regions.txt, soils.txt, and topo.txt.
The variable descriptions are provided in gages_variable_desc_sept3_09.txt. It contains 375 records (one for each variable), ASCII text, tab-delimited.
The Excel spreadsheet, disturb_index6785_sept3_09.xls, is provided as a convenience only as demonstration of how the disturbance index scores were assigned.
Principal Investigator(s):
James A. Falcone
National Water-Quality Assessment Program
U.S. Geological Survey
Reston, Virginia 20192 USA
E-mail: [email protected]
Daren M. Carlisle
National Water-Quality Assessment Program
U.S. Geological Survey
Reston, Virginia 20192 USA
David M. Wolock
National Water-Quality Assessment Program
U.S. Geological Survey
Lawrence, Kansas 66049 USA
Michael R. Meador
National Water-Quality Assessment Program
U.S. Geological Survey
Reston, Virginia 20192 USA
Abstract. Streamflow is a controlling element in the ecology of rivers and streams. Knowledge of the natural flow regime facilitates the assessment of whether specific hydrologic attributes have been altered by humans in a particular stream and the establishment of specific goals for streamflow restoration. Because most streams are ungaged or have been altered by human influences, characterizing the natural flow regime is often only possible by estimating flow characteristics based on nearby stream gages of reference quality, i.e., gaged locations that are least-disturbed by human influences. The ability to evaluate natural streamflow, that which is not altered by human activities, would be enhanced by the existence of a nationally consistent and up-to-date database of gages in relatively undisturbed watersheds.
As part of a national effort to characterize streamflow effects on ecological condition, data for 6785 U.S. Geological Survey (USGS) stream gages and their upstream watersheds were compiled. The sites comprise all USGS stream gages in the conterminous United States with at least 20 years of complete-year flow record from 1950–2007, and for which watershed boundaries could reliably be delineated (median size = 578 km2). Several hundred watershed and site characteristics were calculated or compiled from national data sources, including environmental features (e.g., climate, geology, soils, topography) and anthropogenic influences (e.g., land use, roads, presence of dams, or canals).
In addition, watersheds were assessed for their reference quality within nine broad regions for use in studies intended to characterize streamflows under conditions minimally influenced by human activities. Three primary criteria were used to assess reference quality: (1) a quantitative index of anthropogenic modification within the watershed based on GIS-derived variables, (2) visual inspection of every stream gage and drainage basin from recent high-resolution imagery and topographic maps, and (3) information about man-made influences from USGS Annual Water Data Reports. From the set of 6785 sites, we identified 1512 as reference-quality stream gages. All data derived for these watersheds as well as the reference condition evaluation are provided as an online data set termed GAGES (Geospatial Attributes of Gages for Evaluating Streamflow).
D. Key words: aquatic ecology; dams; hydrologic condition; hydrologic modification; natural flow regime;reference stream gages; streamflow; stream gage network; stream gages; water withdrawal.
CLASS II. RESEARCH ORIGIN DESCRIPTORS
A. Overall project description
Identity: GAGES (Geospatial Attributes of Gages for Evaluating Streamflow): A stream gage database for evaluating natural and altered flow conditions in the conterminous United States.
Originator: Original concept and rationale for this project are from Daren M. Carlisle, David M. Wolock, and Michael R. Meador.
Period of Study: Streamflow records for the stream gages in this data set are from the period 1950–2007.
Objectives: Our primary objective was to delineate watersheds and compile geospatial information for USGS stream gages in the conterminous United States that have relatively long periods of record since 1950. Secondarily, we sought to identify watersheds with USGS stream gages that could be used to characterize streamflows which are minimally affected by hydrologic alteration for major environmental settings within the conterminous United States. Specifically, our intention was to apply a consistent set of criteria to identify watersheds with adequate streamflow records, minimal anthropogenic influences based on the most recent data available, and that represented the natural hydroclimatic and land use regions encountered in the conterminous United States. To do this we assembled a large database describing the natural and anthropogenic conditions and features of these watersheds. The primary purpose of this report is to describe the methods for assembling those data and the results, and to provide links for accessing the data, posted as an online data set. This project was undertaken and supported by the USGS’s National Water-Quality Assessment Program (NAWQA Program; U.S. Geological Survey, 2008a).
Abstract: same as above.
Source(s) of funding: USGS National Water-Quality Assessment Program.
B. Specific subproject description
Site description:Conterminous United States.
Research methods:
Gage screening and watershed boundary delineation
We had several screens for including stream gages in the database. The first screen was a minimum period of record. Although no definitive guideline exists, the HCDN network was based on a 20-year minimum period of record (Slack and Landwehr, 1992), and other researchers suggest that at least 20 years of records are required to reliably characterize hydrologic conditions (Poff, 1996; Richter et al., 1997; Schaake et al., 2000). We therefore limited the stream gages selected to those USGS gages with at least 20 years of complete record, 365 or 366 daily values for each of 20 years, in the period 1950–2007. The 20 years did not have to be continuous. Both active and inactive stream gages were considered.
A further screen for including stream gages was that their watershed boundaries had to be located within the conterminous United States. This was due to the unavailability of consistent ancillary data (for example, land cover, dams, streamlines) for areas outside the conterminous United States. We also excluded stream gages known to be on man-made channels, canals, springs, or flumes. Finally, stream gages with contributing drainage areas greater than 50,000 km2 were excluded because of the time-consuming nature of visually evaluating very large watersheds. Approximately 7400 stream gages met the above criteria.
The final screen was the ability to delineate and ensure the accuracy of watershed boundaries. Boundaries for 689 of the watersheds identified above already existed in the NAWQA Program’s GIS database (nominal scale 1:24 k – 100 k). For these stream gages we used available boundaries because they had previously been validated and quality-assured. For the remaining records we initially delineated watershed boundaries using NHDPlus 30-m resolution flow-accumulation and flow-direction grids (U.S. Environmental Protection Agency 2008) and ArcInfo© Grid commands. We compared the drainage basin size calculated from the digital boundaries with the drainage areas as listed in the USGS National Water Information System (NWIS; U.S. Geological Survey, 2008b), which are based on a variety of sources. Drainage areas exist for the majority, but not all, records in NWIS. We visually checked the watershed boundaries of all records that differed from NWIS by greater than 25%, or for which no drainage area existed in NWIS, and we also visually checked a random sample of stream gages (approximately 1,400) that differed from NWIS by less than 25%, comparing watershed boundaries to NHDPlus 100 k streamlines, gage location and topography, to identify those that were in error. Those stream gages that were deemed to be incorrect were either eliminated (because we believed there was no reliable way to delineate the drainage basin, such as in areas of poor relief), or marked for manual re-delineation. Of the random sample of 1,400 stream gages which were within 25% of the NWIS drainage area, less than 2% were in error. We manually re-delineated watershed boundaries on a one-by-one basis as necessary, using the USGS Elevation Derivates for National Applications (EDNA; U.S. Geological Survey, 2008c) watershed delineation tool, and with assistance from the EDNA program. The final data set resulted in 6785 stream gages. Of these, 5951 watershed boundaries were delineated from 30-m NHDPlus data, 689 taken from the NAWQA database, and 145 from EDNA 30-m data.
Calculation of watershed characteristics
Watershed boundaries were used to calculate watershed and site characteristics from nationally available GIS data sets. We used the NHDPlus 100 k scale stream data set to characterize streamlines (U.S. Environmental Protection Agency 2008), based primarily on NHDPlus data sets available in late 2006. The variables calculated included environmental (climate, soils, geology, hydrology, and topography), landscape (land cover, ecoregions), and anthropogenic influence characteristics (infrastructure, population, current and historical presence of dams, canals, presence of pollution discharge sites). The file gages_variable_desc_sept3_09.txt provides detailed metadata for all variables calculated.
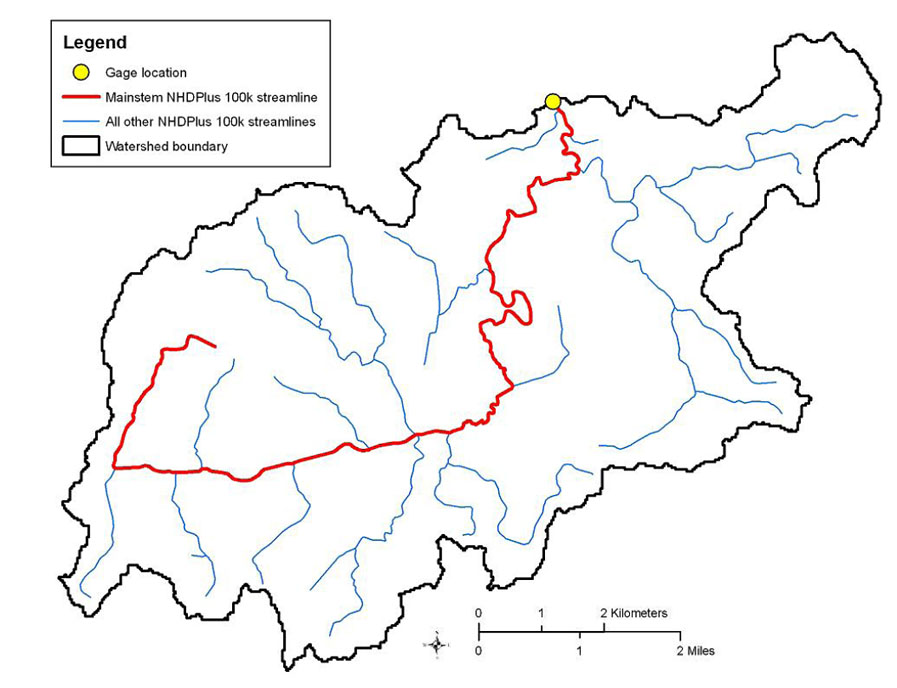
As part of this project we delineated the mainstem streamline for each watershed. This was defined as the primary drainage channel as far upstream from the stream gage as could be determined from the NHDPlus stream data set (Fig. 1), i.e., until the main channel upstream from the gage encountered an ambiguous branching where it was not clear which branch had greater drainage. The NHDPlus "streamlevel" attribute provided the basis for an automated process which generally was correct in defining the main channel streamline, however this was supplemented with manual checks on those that were likely to be incorrect (based on their length) as well as numerous random checks throughout. Approximately 700 (10%) of the mainstem lines were adjusted or corrected manually based on a visual examination of the streamline and on-screen display of the "streamorder" attribute. A number of mainstem-scale characteristics were based on these streamlines.
|
| FIG. 1. Example of mainstem (red) and all other NHDPlus 100 k stream lines (blue) in watershed (U.S. Environmental Protection Agency 2008). |
We calculated land cover based on the most recent National Land Cover Dataset (U.S. Geological Survey, 2008d) at five spatial scales: percentages for the entire watershed, for 100-m and 800-m riparian zone buffers (distance on each side of the stream centerline for all NHDPlus 100k streams in the watershed), and for 100-m and 800-m mainstem zone buffers (distance on each side of the mainstem stream line).
Identification of reference stream gages
Reference conditions of hydrology may be of varying quality, ranging from near pristine conditions in a few regions to "least disturbed" or "best attainable" conditions in most other regions (Stoddard et al., 2006; Table 1). Numerous human activities affect the flow regime of rivers, including dams, diversions, urbanization and drainage modifications, levees and channelization, ground-water pumping, and deforestation (Poff et al., 1997; Dingman, 2002). In some geographic regions these activities are so pervasive that nearly all stream segments might be considered "disturbed" to some degree; whereas in other regions truly undisturbed watersheds exist (Poff et al., 2006). Stoddard et al. (2006) noted that there are at least four variations of reference condition: minimally disturbed, historical, least disturbed, and best attainable condition (Table 1). By necessity, the criteria used to identify reference sites varied among regions that we used (described below), and we define reference as being in a least-disturbed condition.
TABLE 1. Four definitions of "reference condition", from Stoddard et al. (2006).
Term |
Description |
Minimally disturbed condition |
Condition of streams in the absence of significant human disturbance. |
Historical condition |
Condition of streams at some point in their history, for example "pre-settlement ." |
Least disturbed condition |
Least disturbed physical, chemical, and biological habitat conditions given today's state of the landscape. May vary from region to region. |
Best attainable condition |
Expected condition of least disturbed sites if best possible management practices were in use for some period of time. |
We used three primary sources of information for identifying reference-quality stream gages. The first was a hydrologic disturbance index (Falcone et al. 2009) based on seven GIS-generated variables that indicated anthropogenic disturbance of stream flow. The variables were: presence of major dams in the watershed (MAJ_DDENS_2006), change in reservoir storage from 1950–2006 (STOR_2006 - PRE1950_STOR), percentage of streamlines coded canals/ditches/pipelines/artificial_path in the watershed (CANALS_PCT + ARTIFPATH_PCT), road density in the watershed (ROADS_KM_SQ_KM), distance of stream gage to nearest major pollutant discharge site (RAW_DIS_NEAREST_MAJ_NPDES), county-level fresh-water withdrawal estimate (WATER_WITHDR), and fragmentation of undeveloped land in the watershed (FRAGUN_WATERSHED). Stream gages were assigned from 0 to 8 points for each variable based on their percentile value within the data range for all records, then those points were summed for all seven variables, providing an index which ranged from 0 (least likely to have hydrologic disturbance) to 56 (most likely). The index scores were a global metric, calculated the same way for all 6,785 records, but interpreted within the context of individual regions (described below). The index scores were not used as a strict screen; i.e., the scores did not automatically qualify or disqualify a stream gage being classified as a reference watershed, but rather, they were used as one indicator of hydrologic alteration. The spreadsheet in which the disturbance index scores were calculated is included in the zipped data file package, as a convenience.
Secondly, we used 7.5' digital topographic maps and imagery to make qualitative observations of each drainage watershed. Topographic maps were searched for evidence of hydrologic alteration and other human activities near the stream gage. We located each stream gage using Google EarthTM imagery (most imagery post-2000 and typical spatial resolution 1 to 2 m) and examined each watershed and, in particular, the land adjacent to the mainstem and major tributary channels. These images provided evidence of irrigated agriculture (and possible groundwater pumping or streamflow diversions) proximal to or upstream from stream gages. The presence of recently constructed reservoirs also was evident. Further, diversion structures, dams, and constructed channels were often readily visible in high-resolution images. It is noted, however, that it is not possible by visual examination of topographic maps and (even high-resolution) imagery to observe every aspect of flow alteration, particularly very small diversions, wells, and elements of groundwater pumping.
The third source of information for classifying stream gages was local expert judgment about the site as published in USGS Annual Water Data Reports (U.S. Geological Survey, 2008e). Most annual data reports (ADRs) provide information about whether and how streamflow at each stream gage is influenced by regulation (e.g., dams) or diversions (e.g., canals, pipelines, or water withdrawals). We searched reports for the most recent water year in both electronic ADRs (available for the years 2002–2007 for approximately 40% of stream gages in this report), and paper reports (the remaining 60%) for every stream gage, and we recorded any information about regulation and diversions.
Supplementary information was used to identify stream gages that were potentially influenced by streamflow withdrawal for irrigation in arid watersheds. For this subset of stream gages we estimated average streamflow withdrawal for the period 1951–2000, by comparing the measured mean monthly discharge for each stream gage to predictions of mean monthly discharge as estimated from a water balance model (Wolock and McCabe, 1999) for the same period. The water balance model estimates the expected runoff based on climatic conditions but does not account for factors such as land use, water use, or water regulation. We concluded that streamflow withdrawal was severe (and therefore disqualified a stream gage as possible reference quality) if the ratio of observed to expected monthly flows during the growing season (May–September) was << 1.
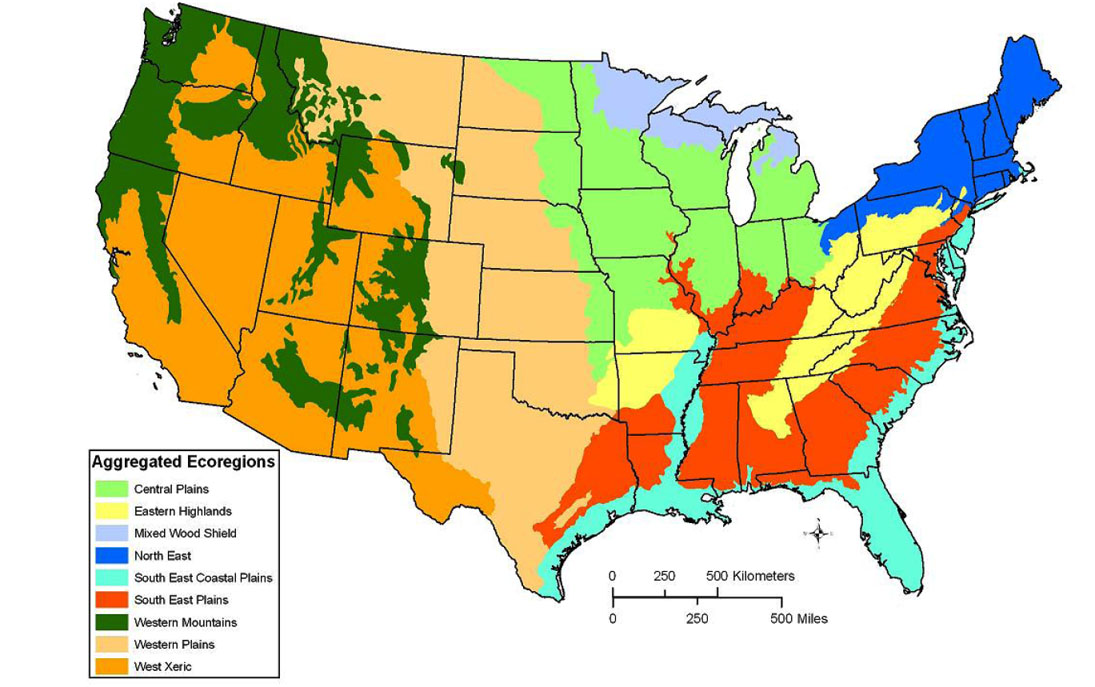
Once compilation of data was complete for the above sources of information, we separated the 6,785 stream gages into nine broad regions (Fig. 2), based on our aggregation of U.S. Environmental Protection Agency (USEPA) Level II ecoregions (Omernik 1987), similar to those used by the USEPA in their national Wadeable Stream Assessment (U.S. Environmental Protection Agency 2006a). Although other types of regional groupings were considered (for example, USGS Water Resources Regions [Seaber et al. 1987] or hydrologic landscape regions [Winter 2001, Wolock 2003d]), the USEPA Level II groupings provided a framework for aggregating stream gages into areas with similar landform, climatic, and anthropogenic land use characteristics, and at a scale for which at least several hundred observations were available in each region. Each watershed was assigned to the aggregated ecoregion containing the majority of its area. We evaluated the stream gages separately by aggregated ecoregion, based on our judgment of the three criteria described above (disturbance index, topo maps and imagery, and ADR remarks), to identify those stream gages with the least-disturbed hydrologic condition within each region. These are termed "reference" in the posted data set. All others are termed "non-reference." Users should note that within these broad regions there may still be variation in topographic, geologic, and other settings, and that for particular scales or applications users may wish to refine the reference gages defined in this report, based on the posted data.
|
| FIG. 2. Aggregated ecoregions used in reference condition classification. These nine regions are our aggregation of USEPA Level II ecoregions (Omernik 1987). |
Project personnel:
See Acknowledgments.
CLASS III. DATA SET STATUS AND ACCESSIBILITY
A. Status
Latest update:
September, 2009.
Metadata status:
Metadata are complete. Full metadata for all data are provided in the file gages_variable_desc_sept3_09.txt.
Data verification:
Numerous verification procedures were taken in the compilation of these data, including validation of watershed boundaries and mainstem streamlines (see Research Methods, above), and screening of data for outliers and improbable values by multiple individuals.
B. Accessibility
Storage location and medium:
Ecological Society of America data archives, URL published in each issue of its journals.
Contact person:
James Falcone, National Water-Quality Assessment (NAWQA) program, U.S. Geological Survey, Reston, Virginia, 20192 USA; telephone: 703-648-5008; email: [email protected].
Copyright restrictions:
None
Proprietary restrictions:
None
Costs:
None
CLASS IV. DATA STRUCTURAL DESCRIPTORS
A. Data set files
Identity and size:
gages_basinchar_sept3_09.zip Zipped file size 7.0 MB. The zipped file contains 25 text files in tab delimited format, one ASCII tab-delimited text file containing variable descriptions, and one MS Excel spreadsheet showing the hydrologic disturbance index score calculation.
Each of the 25 text data files has 6785 records (one record for each streamgage), identified by the unique identifier field GAGE_ID. Each file contains data values for one or more variables for a class of data, as described below:
The 25 files are:
basinid.txt: Basic identification characteristics of the stream gage (e.g., name, drainage area, lat/long, water resources region).
bas_classif.txt: Reference/non-reference classification and primary quantitative information that went into the classification decision, including pertinent ADR remarks.
bas_morph.txt: Basin morphology (e.g., compactness ratio).
census_block.txt: Population densities derived from Census Block-level data.
census_county.txt: Population densities derived from Census County-level data.
climate.txt: Climate characteristics (e.g., mean precipitation, temperature).
geology.txt: Geological characteristics (e.g., dominant geology in watershed).
hydro.txt: Hydrologic characteristics derived from GIS data (e.g., stream order at the streamgage, base-flow-index, percent runoff).
hydromod_dams.txt: Information about historical and current dams in the watershed.
hydromod_other.txt: Information about other anthropogenic hydrologic modifications (e.g., percent canals in watershed or on mainstem, presence of permitted pollution discharge sites, estimate of water withdrawal).
infrastructure.txt: Road density and percent impervious surfaces in watershed.
landscape_pat.txt: Landscape pattern metric(s) (e.g., fragmentation of undeveloped land).
lc01_basin.txt: Percentages of land cover circa year 2001 in the watershed.
lc_change92_01.txt: Estimates of changes from 1992 to 2001 in percentages of major land cover classes.
lc01_mains100.txt: Percentages of land cover classes in 100-m mainstem buffer (100 m each side of mainstem stream line).
lc01_mains800.txt: Percentages of land cover classes in 800-m mainstem buffer (800 m each side of mainstem streamline).
lc01_rip100.txt: Percentages of land cover classes in 100-m riparian buffer (100 m each side of all streamlines in watershed).
lc01_rip800.txt: Percentages of land cover classes in 800-m riparian buffer (800 m each side of all streamlines in watershed).
nutrient_app.txt: Estimates of nitrogen and phosphorus application in the watershed.
pest_app.txt: Estimates of agricultural pesticide application in the watershed.
prot_areas.txt: Percent area of the watershed in "protected" land cover zones (e.g., National Parks, Wilderness Areas)
reach.txt: Reachcode for linking to NHDPlus for obtaining reach data, as well as the type of stream at the reach (StreamRiver, Canal, etc.).
regions.txt: Site location and percent of watershed area in various regions (e.g., EPA Level II or III ecoregions).
soils.txt: Soils characteristics.
topo.txt: Topographic characteristics (e.g., mean basin elevation, mean slope).
The file gages_variable_desc_sept3_09.txt contains metadata for the variables in the data files above. This metadata file has 375 records; each record has detailed information about a specific variable. The file is in tab-delimited text format.
The MS Excel spreadsheet is named disturb_index6785_sept3_09.xls. This file is provided as a convenience only as demonstration of how the disturbance index scores were assigned. Instructions on how to modify the spreadsheet, if so desired, are provided in the "notes" worksheet.
Format and storage media:
gages_basinchar_sept3_09.zip - zipped file containing 25 text files in tab-delimited format, one tab-delimited text file containing variable descriptions, and one Excel spreadsheet, described above.
Header information:
The metadata file gages_variable_desc_sept3_09.txt contains all explanatory header information for the main data files. The header fields for the metadata file itself are as follows:
Variable type: Variable type; indicates the file containing the variable (e.g., "hydro").
Variable name: The variable name (e.g., "Strahler_max").
Description: A text description of the variable (e.g., "Maximum Strahler stream order in watershed").
Extent: Spatial extent of GIS processing for that variable: either "watershed", "site", "reach", "riparian", or "mainstem". Unless indicated otherwise "watershed" indicates that the value represents the mean for the watershed for that parameter, "site" represents the value for the point location at the streamgage, "reach" represents data for the NHDPlus streamline which intersects with the gage location, "riparian" represents the mean for the riparian zone indicated, and "mainstem" represents the mean for the mainstem zone indicated.
Storage type: Storage type: either "character", "integer", "floating point", or "date".
Units: Units (e.g., "percent" or "km2").
Time period: Time period of the source data (e.g. "1971–2000").
Processing method: Type of processing: either "grid", "vector polygon", "vector line", "vector point", or "join".
Additional note on processing or dataset: Additional information about unusual or noteworthy aspects of processing, including No Data values, if applicable.
Source data: Source of data (e.g., "NHDPlus"); usually the agency, organization, or program that created the data.
Nominal resolution/scale of source data: Resolution or scale (e.g., "1:100,000", or "30-m resolution grid").
Citation: Reference for source data and/or processing method.
Web site for source data: URL for source data, if online.
Checksum: Sums for numeric variable columns, for data authentification. These values should match the sums of data columns in the 25 text files.
Alphanumeric attributes:
See "Storage type" in gages_variable_desc_sept3_09.txt.
Special characters/fields:
See "Additional note on processing" in gages_variable_desc_sept3_09.txt.
Authentification procedures:
See "Checksum" in gages_variable_desc_may_09.txt. Summing values for any numeric variable column should match the value given in the metadata file.
B. Variable information
The metadata file gages_variable_desc_sept3_09.txt contains all explanatory header information for the main data files.
While GIS data sets (e.g., ArcInfo coverages or grids) are not included with this report, the projection information used for the project may be of interest:
Projection: Albers Equal-Area
Datum: NAD83
Units: Meters
Spheroid: GRS1980
Parameters:
| 29 | 30 | 00 |
| 45 | 30 | 00 |
| -96 | 00 | 00 |
| 23 | 00 | 00 |
False Easting: 0
False Northing: 0
CLASS V. SUPPLEMENTAL DESCRIPTORS
A. Data acquisition
Data forms:
N/A
Location of completed data forms:
N/A
B. Quality assurance/quality control procedures:
See Class III, A. Status, Verification, above.
C. Related material:
N/A
D. Computer programs and data processing algorithms:
GIS data were derived primarily using the ArcInfo© version 9.2 suite of software. Information about derivation of specific metrics is available from the corresponding author.
Any use of trade, product, or firm names is for descriptive purposes only and does not imply endorsement by the U.S. Government.
E. Archiving:
N/A
F. Publication and results:
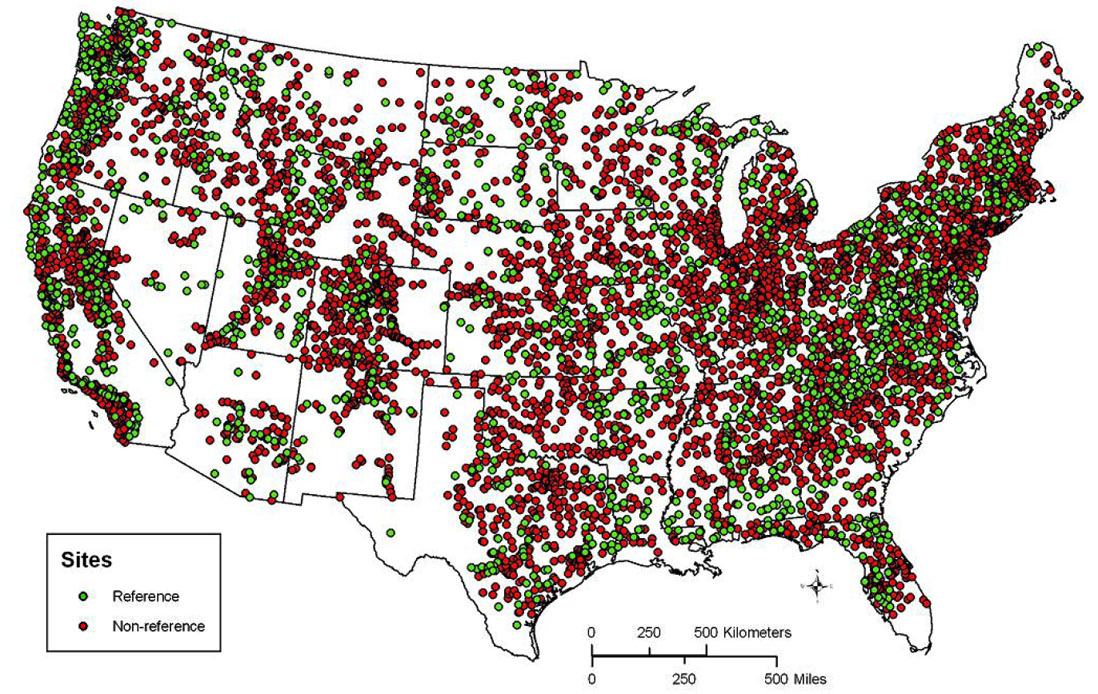
We identified 1512 stream gages as being in reference-quality conditions in their respective ecoregions (Fig. 3 and Table 2). Approximately 25% of stream gages in each region were classified as reference, but this varied from a low of 17% of stream gages in the Central Plains to a high of 28% in the Eastern Highlands. Reference watersheds tended to be smaller (median size 242.4 km2, compared to 794.4 km2 for non-reference) than non-reference watersheds. Reference streams were on average of somewhat lower stream order than non-reference. In general, reference watersheds tended to be at higher elevation (median watershed elevation 494 m) than non-reference watersheds (414 m). Users of these data should be attentive to differences between reference and non-reference watersheds if employing the classification presented here. 76% of non-reference stream gages had ADR remarks indicating diversions, regulation, or flow modifications, whereas 20% of reference stream gages had similar indication. For the reference stream gages nearly all of these remarks were indicative of only minor influences, based on our interpretation of the ADR remarks.
|
| FIG. 3. Location of reference (n = 1512) and non-reference (n = 5273) stream gages identified in this project. |
TABLE 2. Median values for selected characteristics of reference ("ref") and non-reference ("non-ref") stream gages for each aggregated ecoregion. Units for drainage area are km2, for elevation are meters, for road density are km/km2, for dam storage are 1,000 m3/km2, and for land cover are percent. Stream order (Strahler), and hydro-disturbance index are unitless. Higher numbers of the hydro-disturbance index indicate more disturbance.
Aggregated ecoegion |
Type |
n |
Drainage area |
Stream order at gage |
Mean watershed elevation |
Road density |
Dam storage |
Undeveloped land cover, watershed |
Hydro disturbance index |
Central Plains |
ref |
153 |
454.9 |
4 |
301 |
1.27 |
1.7 |
22.9 |
13.0 |
non-ref |
767 |
953.9 |
4 |
288 |
1.59 |
11.1 |
16.8 |
21.0 |
|
Eastern Highlands |
ref |
210 |
283.1 |
4 |
467 |
1.27 |
0.2 |
84.1 |
10.0 |
non-ref |
531 |
895.1 |
5 |
412 |
1.78 |
39.4 |
75.0 |
21.0 |
|
Mixed Wood Shield |
ref |
41 |
487.2 |
4 |
391 |
0.89 |
2.8 |
94.4 |
11.0 |
non-ref |
109 |
1387.0 |
4 |
407 |
1.22 |
47.0 |
91.1 |
17.0 |
|
North East |
ref |
139 |
172.5 |
3 |
449 |
1.30 |
0.7 |
88.8 |
12.0 |
non-ref |
527 |
443.3 |
4 |
343 |
1.69 |
90.5 |
78.3 |
22.0 |
|
South East Coastal Plains |
ref |
64 |
181.9 |
3 |
22 |
1.34 |
0.0 |
69.6 |
14.0 |
non-ref |
213 |
200.9 |
3 |
28 |
2.08 |
0.8 |
43.1 |
22.0 |
|
South East Plains |
ref |
215 |
277.4 |
4 |
127 |
1.40 |
1.2 |
79.0 |
11.0 |
non-ref |
776 |
653.7 |
4 |
144 |
1.83 |
20.8 |
61.1 |
21.0 |
|
Western Mountains |
ref |
442 |
168.6 |
3 |
1567 |
0.79 |
0.0 |
99.5 |
7.0 |
non-ref |
1265 |
642.6 |
4 |
2086 |
0.88 |
27.7 |
98.3 |
15.0 |
|
Western Plains |
ref |
119 |
957.0 |
4 |
613 |
0.99 |
1.3 |
84.0 |
10.0 |
non-ref |
581 |
2698.8 |
5 |
674 |
1.20 |
22.8 |
73.4 |
17.0 |
|
West Xeric |
ref |
129 |
120.6 |
3 |
1407 |
0.59 |
0.0 |
99.2 |
7.0 |
non-ref |
504 |
792.2 |
5 |
1196 |
1.00 |
12.8 |
95.0 |
15.0 |
|
All |
ref |
1512 |
242.4 |
4 |
494 |
1.15 |
0.0 |
92.3 |
10.0 |
non-ref |
5273 |
794.4 |
4 |
414 |
1.44 |
22.0 |
77.4 |
19.0 |
As of 2007, 4609 stream gages (68%) in the database were active (Table 3). 954 (63%) of the reference stream gages were active. All stream gages had at least a 20-yr period of complete flow record, and more than half (n = 3686; 54%) had at least a 40-yr period of record in the 58-yr period 1950–2007 that we considered.
TABLE 3. Number and percent of stream gages that had at least 30, 40, and 50 years of streamflow record from 1950–2007, and number and percent of stream gages that were active in 2007 (U.S. Environmental Protection Agency 2008).
Length of flow record (water years from 1950 to 2007) |
||||
Type |
>= 30 years |
>= 40 years |
>= 50 years |
Gage active in 2007 |
Ref |
1016 (67%) |
719 (48%) |
420 (28%) |
954 (63%) |
Non-ref |
3914 (74%) |
2967 (56%) |
2076 (39%) |
3655 (69%) |
All |
4930 (73%) |
3686 (54%) |
2496 (37%) |
4609 (68%) |
A stream gage’s membership in the HCDN was not considered in the screening process described in this report, but a comparison was made to that network. Of the original 1659 HCDN stream gages (which spanned all 50 US states + territories), 1457 are in the data set described herein. Of these, 550 are classified as reference, and 907 classified as non-reference. That is, more than 60% of the HCDN stream gages in the conterminous USA are not in current reference condition, by the criteria used in this study. However, as stated earlier, the HCDN sites were not necessarily intended to represent current reference conditions, especially for riverine ecological interpretations. The HCDN methods and criteria for inclusion were formulated 20 years ago (Slack and Landwehr 1992) and were substantially different from methods and criteria described herein. For example, the HCDN period of record differed from ours, the HCDN allowed leeway for some sites with less than 20 years of record, and also allowed for watersheds that had man-made influences but were believed to not have changed over the period of record.
It should be noted that the classification assigned in this project (reference or non-reference) was based on our semi-quantitative evaluation of the criteria described above, which included both quantitative and qualitative data. Our classification is intended as the best identification of reference-quality sites that we could perform given the limitations of national-scale data, and within the context of the regions we used. It was believed that the deficiencies of national-scale GIS data, which do not capture small diversions, dams or groundwater pumping particularly well, would be supplemented by an examination of ADR remarks and visual examination of every watershed from high-resolution imagery. Even given that, however, it is possible that users with localized knowledge may be able to perform a better classification for specific areas. We also note that it would be possible to use the data posted here to identify a different, but equally valid, set of reference-quality stream gages for other purposes, based on other regions, or which place greater emphasis on specific anthropogenic activities or variables (e.g., urbanization), and that the classification presented here is not intended to be definitive.
G. History of data set usage:
N/A
H. Data set update history:
N/A
ACKNOWLEDGMENTS
We gratefully recognize the tremendous work done for this project by Lisa Weber, Kelly Ruhl, and Michael Wieczorek, as well as the helpful colleague reviews provided by Al Rea, Ken Eng, and Kerie Hitt, all of the USGS, and of the three journal reviewers. We also acknowledge the USGS EDNA program, for assistance and guidance on basin delineation methods, particularly Sandra Poppenga, Susan Greenlee, and Bruce Worstell.
LITERATURE CITED (in report or variable descriptions)
AAPFCO (Association of American Plant Food Control Officials). 2009. Association of American Plant Food Control Officials. Accessed in May 2009 at http://www.aapfco.org/.
Arthington, A. H., S. E. Bunn, N. L. Poff, and R. J. Naiman. 2006. The challenge of providing environmental flow rules to sustain river ecosystems. Ecological Applications 16(4):1311–1318.
Carlisle, D. M., J. Falcone, D. M Wolock, M. R. Meador, and R. H. Norris. 2009. Predicting the natural flow regime: models for assessing hydrological alteration in streams. River Research and Applications, in press, DOI at: http://dx.doi.org/10.1002/rra/1247.
Conservation Biology Institute. 2006. Protected Areas Database (PAD) Version 4. Conservation Biology Institute. Accessed in January 2006 at http://www.consbio.org/.
DiLuzio, M., G. L. Johnson, C. Daly, J. K. Eischeid, and J. G. Arnold. 2008. Constructing retrospective gridded daily precipitation and temperature datasets for the conterminous United States. Journal of Applied Meteorology and Climatology 47: 475–497
Dingman, S. L. 2002. Physical Hydrology, Second Edition. Prentice Hall, Upper Saddle River, NJ, USA.
Falcone, J. A., D. M. Carlisle, and L. C. Weber. 2009. Quantifying human disturbance in watersheds: variable selection and performance of a GIS-based disturbance index for predicting the biological condition of perennial streams. Ecological Indicators, in press, DOI at: http://dx.doi.org/10.1016/j.ecolind.2009.05.005.
GeoLytics. 2001. Census 2000 and street 2000. East Brunswick, NJ, US. GeoLytics, Inc., 2 CDROMS.
Hamon, W. R. 1961. Estimating potential evapotranspiration. Journal of the Hydraulics Division, Proceedings of the American Society of Civil Engineers 87:107–120.
Holmes, M. G. R., A. R. Young, A. G. Gustard, and R. Grew. 2002. A Region of Influence approach to predicting Flow Duration Curves within ungauged catchments. Hydrology and Earth System Sciences 6(4):721–731.
Hunt, C. D. 1979. National Atlas of the United States of America – Surficial Geology. U.S. Geological Survey. NAC-P-0204-75M-O [map].
Krug, W. R., W. A. Gebert, and D. J. Graczyk. 1989. Preparation of average annual runoff map of the United States, 1951-80. U.S. Geological Survey Open-File Report 87-535.
Markham, Charles G. 1970. Seasonality of precipitation in the United States. Annals: Association of American Geographers 60:593–597.
McCabe, G. J., and D. M. Wolock. 2009. Variability in Northern Hemisphere snow cover. Climatic Change, in press.
Nakagaki, N., and D. M. Wolock. 2005. Estimation of agricultural pesticide use in drainage basins using land cover maps and county pesticide data. U.S. Geological Survey Open-File Report 2005-1188.
Omernik, J. M. 1987. Ecoregions of the conterminous United States. Annals: Association of American Geographers 77(1):118–125.
Orsborn, J.F. 1974. Determining streamflows from geomorphic parameters. Journal of the Irrigation and Drainage Division 100(4):455–475.
Poff, N. L. 1996. A hydrogeography of unregulated streams in the United States and an examination of scale-dependence in some hydrological descriptors. Freshwater Biology 36:71–91.
Poff, N. L., J. D. Allan, M. B. Bain, J. R. Karr, K. L. Prestegaard, B. D. Richter, R. E. Sparks, and J. C. Stromberg. 1997. The natural flow regime: a paradigm for river conservation and restoration. BioScience 47:769–784.
Poff, N. L., B. D. Bledsoe, and C. O. Cuhaciyan. 2006. Hydrologic variation with land use across the contiguous United States: geomorphic and ecological consequences for stream ecosystems. Geomorphology 79:264–285.
Poff, N. L., B. Richter, A. H. Arthington, S. E. Bunn, R. J. Naiman, E. Kendy, M. Acreman, C. Apse, B. P. Bledsoe, M. Freeman, J. Henriksen, R. B. Jacobson, J. Kennen, D. M. Merritt, J. O’Keeffe, J. D. Olden, K. Rogers, R. E. Tharme, and A. Warner. 2009. The Ecological Limits of Hydrologic Alteration (ELOHA): a new framework for developing regional environmental flow standards. Freshwater Biology, in press, DOI at: http://dx.doi.org/ 10.1111/j.1365-2427.2009.02204.x
PRISM Group. 2008. Parameter-Elevation Regressions on Independent Slopes Model (PRISM) Home Page. PRISM Group, Oregon State University. Accessed in October 2008 at http://www.prism.oregonstate.edu/.
Reed, J. C., and C. A. Bush. 2001. Generalized geologic map of the conterminous United States. In National Atlas (www.nationalatlas.gov). U.S. Geological Survey, Denver, Co.
Richter, B. D., J. V. Baumgartner, J. Powell, and D. P. Braun. 1996. A method for assessing hydrologic alteration within ecosystems. Conservation Biology 10:1163–1174.
Richter, B. D., J. V. Baumgartner, R. Wigington, and D. P. Braun. 1997. How much water does a river need? Freshwater Biology 37:231–249.
Riitters, K. H., J. D. Wickham, R. O’Neill, B. Jones, and E. Smith. 2000. Global-scale patterns of forest fragmentation. Conservation Ecology 4:3. [online] http://www.consecol.org/vol4/iss2/art3.
Ruddy, B. C., D. L. Lorenz, and D. K. Mueller. 2006. County-level estimates of nutrient inputs to the land surface of the conterminous United States, 1982-2001. U.S. Geological Survey Scientific Investigations Report 2006-5012.
Sanborn, S. C., and B. P. Bledsoe. 2006. Predicting streamflow regime metrics for ungauged streams in Colorado, Washington, and Oregon. Journal of Hydrology 325:241–261.
Seaber, P. R., F. P. Kapinos, and G. L. Knapp. 1987. Hydrologic Unit Maps. U.S. Geological Survey Water-Supply Paper 2294.
Shaake, J., D. Qingyun, M. Smith, and V. Koren. 2000. Criteria to select watersheds for hydrologic model development and testing. 15th Conference on Hydrology, American Meteorological Society. Accessed in November 2008 at http://www.nws.noaa.gov/oh/hrl/papers/ams/ams_2000_1.8.pdf.
SILVIS Lab. 2008. The Wildland-Urban Interface, GIS data library. Forest and Wildlife Ecology, University of Wisconsin-Madison. Accessed in October 2008 at http://silvis.forest.wisc.edu/projects/WUI_Main.asp.
Slack, J. R., and J. M. Landwehr. 1992. Hydro-climatic data network (HCDN): A U.S. Geological Survey streamflow data set for the United States for the study of climate variations, 1874–1988. U.S. Geological Survey Open-File Report 92-129.
Soil Survey Staff. 1981. Land resource regions and major land resource areas of the United States. Agriculture Handbook 296. Rev. Ed. United States Department of Agriculture, Soil Conservation Service. Washington, DC, USA.
Stoddard, J. L., D. P. Larsen, C. P. Hawkins, R. K. Johnson, and R. N. Norris. 2006. Setting expectations for the ecological condition of streams: The concept of reference condition. Ecological Applications 16(4):1267–1276.
Thomas, D. M., and M. A. Benson. 1970. Generalization of streamflow characteristics from drainage-watershed characteristics. U.S. Geological Survey Water Supply Paper 1975.
U.S. Army Corps of Engineers. 2006. National Inventory of Dams. U.S. Army Corps of Engineers. Accessed in July 2006 at http://crunch.tec.army.mil/nidpublic/webpages/nid.cfm. (public access may now (2009) be restricted).
U.S. Census Bureau. 2008. U.S. Census Bureau Cartographic County Boundary Files. U.S. Census Bureau. Accessed in October 2008 at http://www.census.gov/geo/www/cob/index.html.
U.S. Environmental Protection Agency. 1998. National strategy for the development of regional nutrient criteria. 822-R-98-002. U.S. Environmental Protection Agency Office of Water, Washington, DC.
U.S. Environmental Protection Agency. 2006a. Wadeable Streams Assessment: A Collaborative Survey of the Nation’s Streams. U.S. Environmental Protection Agency; EPA 841-B-06-002 December 2006. Accessed in October 2007 at http://www.epa.gov/owow/streamsurvey/.
U.S. Environmental Protection Agency. 2006b. National Pollutant Discharge Elimination System (NPDES): U.S. Environmental Protection Agency; accessed in June 2006 at http://cfpub.epa.gov/npdes/.
U.S. Environmental Protection Agency. 2008. National Hydrography Dataset Plus (NHDPlus) Home Page. USEPA, USGS, and Horizon Systems Corporation. Accessed in October 2008 at http://www.horizon-systems.com/nhdplus/.
U.S. Geological Survey. 2008a. USGS National Water-Quality Assessment (NAWQA) Program. U.S. Geological Survey. Accessed in October 2008 at http://water.usgs.gov/nawqa/.
U.S. Geological Survey. 2008b. USGS Water Data for the Nation (National Water Information System). U.S. Geological Survey. Accessed in October 2008 at http://waterdata.usgs.gov/nwis/.
U.S. Geological Survey. 2008c. Elevation Derivatives for National Applications (EDNA). U.S. Geological Survey. Accessed in October 2008 at http://edna.usgs.gov/.
U.S. Geological Survey. 2008d. National Land Cover Database 2001 (NLCD 2001). U.S. Geological Survey. Accessed in October 2008 at http://www.mrlc.gov/nlcd.php.
U.S. Geological Survey. 2008e. Annual Water Data Reports Home Page. U.S. Geological Survey. Accessed in October 2008 at http://wdr.water.usgs.gov/.
U.S. Geological Survey. 2008g. Water Use in the United States. U.S. Geological Survey. Accessed in October 2008 at http://water.usgs.gov/watuse.
U.S. Geological Survey. 2008h. National Elevation Dataset. U.S. Geological Survey. Accessed in October 2008 at http://ned.usgs.gov/.
Vogel, R. M., I. Wilson, and C. Daly. 1999. Regional regression models of annual streamflow for the United States. Journal of Irrigation and Drainage Engineering 125 (3):148–157.
Wallis, J. R., D. P. Lettenmaier, and E. F. Wood. 1991. A daily hydroclimatological data set for the continental United States. Water Resources Research 27:1657–1663.
Winter, T. C. 2001. The concept of hydrologic landscapes. Journal of the American Water Resources Association 37:335–349.
Wolock, D. M., G. M. Hornberger, K. J. Beven, and W. G. Campbell. 1989. The relationship of catchment topographic and soil hydraulic characteristics to lake alkalinity in the northeastern United States. Water Resources Research 25:829–838.
Wolock, D. M. 1993. Simulating the variable-source-area concept of streamflow generation with the watershed model TOPMODEL. U.S. Geological Survey Water-Resources Investigations Report 93-4124.
Wolock, D. M., and G. J. McCabe. 1995. Comparison of single and multiple flow direction algorithms for computing topographic parameters in TOPMODEL. Water Resources Research 31:1315–1324.
Wolock, D. M. 1997. STATSGO soil characteristics for the conterminous United States. USGS Open-File Report 97-656. Accessed in October 2008 at http://water.usgs.gov/GIS/metadata/usgswrd/XML/muid.xml.
Wolock, D.M. and G.J. McCabe. 1999. Estimates of runoff using water-balance and atmospheric general circulation models. Journal of the American Water Resources Association 35(6):1341–1350.
Wolock, D. M. 2003a. Base-flow index grid for the conterminous United States. U.S. Geological Survey Open-File Report 03–263, digital data set. Accessed in October 2008 at http://water.usgs.gov/GIS/metadata/usgswrd/XML/bfi48grd.xml.
Wolock, D. M. 2003b. Saturated overland flow estimated by TOPMODEL for the conterminous United States. U.S. Geological Survey Open-File Report 03–310, digital data set. Accessed in October 2008 at http://water.usgs.gov/GIS/metadata/usgswrd/XML/satof48.xml.
Wolock, D. M. 2003c. Infiltration-excess overland flow estimated by TOPMODEL for the conterminous United States. U.S. Geological Survey Open-File Report 03–310, digital data set. Accessed in October 2008 at http://water.usgs.gov/GIS/metadata/usgswrd/XML/ieof48.xml.
Wolock, D. M. 2003d. Hydrologic landscape regions of the United States. U.S. Geological Survey Open-File Report 03–145, digital data set. Accessed in October 2008 at http://water.usgs.gov/GIS/metadata/usgswrd/XML/hlrus.xml.