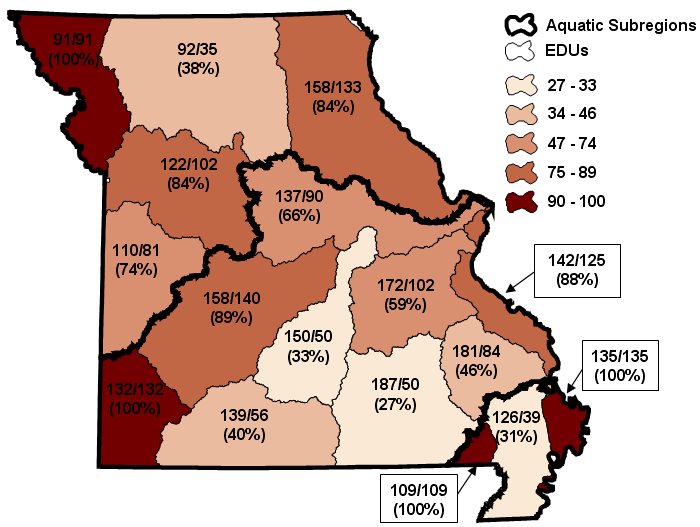
Appendix P. A map showing the total number of native fish, mussel, and crayfish species within each Ecological Drainage Unit (EDU) and the corresponding number and percentage (in parentheses) of those species that have fewer than two distinct occurrences represented in the status 1 or 2 lands that occur within each respective EDU. Graduated colors represent the percentage of species having fewer than two distinct occurrences.