Ecological Archives M085-022-A3
Alan J. Tepley and Thomas T. Veblen. 2015. Spatiotemporal fire dynamics in mixed-conifer and aspen forests in the San Juan Mountains of southwestern Colorado, USA. Ecological Monographs 85:583603. http://dx.doi.org/10.1890/14-1496.1
Appendix C. Simulation methods for evaluating the degree to which tree regeneration depends on fire under historical and contemporary fire regimes.
If fire plays an important role in stimulating recruitment of a tree species (either by creating canopy gaps or by reducing herb and shrub cover and providing a seedbed of mineral soil for new seedling establishment), we would expect pith dates of that species to fall primarily within a short window following fire. In a regime of relatively frequent fire (e.g., fire intervals typically <50 years), however, most pith dates may fall within the first few decades following fire, but it may be difficult to determine whether this illustrates a dependence on fire for regeneration or if it is an artifact of the short time available for tree recruitment between successive fires. For example, there may be few fire-free intervals long enough to determine whether recruitment remains high long after fire or if it eventually declines with increasing time since fire. Therefore, we developed a procedure to compare the observed distribution of pith dates to simulated distributions generated under the null hypothesis that tree recruitment is independent of time since fire.
We demonstrate the simulation procedure for a theoretical dataset of 26 trees (8 aspen, 8 Douglas-fir, and 10 white fir) and 4 fire dates as an example of the type of data analyzed in the present study (actual data include an average of 54 pith dates per stand). For each tree, we list the forest type, species, pith date (p), date of the most recent fire to affect the stand prior to the pith date (![]() ), and the date of the next fire in the respective stand (
), and the date of the next fire in the respective stand (![]() ; Table C1). Also, fire years are labeled as ‘Recent’ for the most recent fire to burn the stand, or ‘Historical’ for all fires prior to the most recent fire per stand. We converted each pith date to the number of years since fire (
; Table C1). Also, fire years are labeled as ‘Recent’ for the most recent fire to burn the stand, or ‘Historical’ for all fires prior to the most recent fire per stand. We converted each pith date to the number of years since fire (![]() ) and complied these values by species for all historical fires and over the interval since the most recent fire.
) and complied these values by species for all historical fires and over the interval since the most recent fire.
In each simulation replicate, we generate one pith date for each tree in the observed data set, where each simulated pith date (![]() ) is generated as a random number uniformly distributed between
) is generated as a random number uniformly distributed between ![]() and
and ![]() (Table C1). We then convert the simulated pith dates to time since fire (
(Table C1). We then convert the simulated pith dates to time since fire (![]() ) and compile these values by species across all historical fires and over the interval since the most recent fire. Thus, each simulation replicate generates a dataset that includes the same fire years as in the observed data set and the number of trees of each species with pith dates in each fire interval is equal to that in the observed data. The only difference is that the simulated pith dates are randomly distributed over the intervals between consecutive fires (Table C1).
) and compile these values by species across all historical fires and over the interval since the most recent fire. Thus, each simulation replicate generates a dataset that includes the same fire years as in the observed data set and the number of trees of each species with pith dates in each fire interval is equal to that in the observed data. The only difference is that the simulated pith dates are randomly distributed over the intervals between consecutive fires (Table C1).
In simulating pith dates after the most recent fire to affect each stand, the year of the next fire (![]() ) is not known. The time available for trees to establish and be recorded in our data set is limited by the time it takes to reach the minimum size for which increment cores were collected (15 cm dbh). Altogether we cored 500 trees 15–20 cm dbh and found a mean pith date of 1933 (range 1776–1986) and only 22 pith dates (4%) after 1970. Based on this finding, we made the conservative assumption that trees that established before 1970 were likely to have reached 15 cm dbh at the time of sampling, whereas younger trees were less likely to have reached 15 cm dbh. Therefore, for the most recent fire per stand, we set
) is not known. The time available for trees to establish and be recorded in our data set is limited by the time it takes to reach the minimum size for which increment cores were collected (15 cm dbh). Altogether we cored 500 trees 15–20 cm dbh and found a mean pith date of 1933 (range 1776–1986) and only 22 pith dates (4%) after 1970. Based on this finding, we made the conservative assumption that trees that established before 1970 were likely to have reached 15 cm dbh at the time of sampling, whereas younger trees were less likely to have reached 15 cm dbh. Therefore, for the most recent fire per stand, we set ![]() to the year 1970 in representing the upper bound on the time available for trees to establish since the most recent fire and be recorded in our dataset (Table C1). In the few stands where we recorded a pith date after 1970, we set
to the year 1970 in representing the upper bound on the time available for trees to establish since the most recent fire and be recorded in our dataset (Table C1). In the few stands where we recorded a pith date after 1970, we set ![]() to the pith date of the youngest sampled tree.
to the pith date of the youngest sampled tree.
We compare the observed age-structure data to that of three simulation replicates (Fig. C1a). Then the data are compared after pith dates have been converted to time since fire and compiled by species across all historical fires and for the interval since the most recent fire per stand (Fig. C1b). For this illustration of only three replicates, we averaged the proportion of simulated pith dates in each five-year bin across replicates and then visually compared these values to the proportion of observed pith dates in each bin (Fig. C1b).
For the simulations using real data, 999 replicates were conducted. Then we assigned the observed proportion of pith dates in each five-year bin a percentile rank relative to the proportion of simulated pith dates in the respective bin. We used five-year bins because compiling a large number of pith dates across multiple stands and fire years might reveal patterns at shorter timescales than are evident in the smaller sample in a single stand.
If the observed proportion of pith dates had moderate rankings relative to the simulated values for each bin, and the observed percentile ranks showed no trend with increasing time since fire, it would suggest the regeneration of that species was not dependent on fire. By contrast, we would interpret that the regeneration of a given species was dependent on fire if the observed proportion of pith dates was toward the upper percentiles of the simulated values immediately after fire, but it then fell to the lowest percentiles with increasing time since fire. Furthermore, if the time it took the species to drop from the uppermost to the lowermost percentiles relative to the simulated values was shorter than the fire intervals commonly experienced under the historical fire regime, we would interpret that it was probably common for stands to reach relatively closed-canopy conditions over the intervals between successive fires.
Table C1. Theoretical sample data and three simulation replicates illustrating the procedure for evaluating the dependence of tree recruitment on fire. Data are presented for an “observed” data set of 26 trees (not actual data used in this study) and four fire years (1819, 1861, 1879, and 1902). On the left, each pith date (p) is converted to the number of years since fire (![]() ). On the right, three replicates are shown where one pith date (
). On the right, three replicates are shown where one pith date (![]() ) is simulated for each pith date in the observed dataset and then converted to the number of years since fire (
) is simulated for each pith date in the observed dataset and then converted to the number of years since fire (![]() ) using the fire dates in the same row of the table. Each simulated pith date was drawn as a random number uniformly distributed between
) using the fire dates in the same row of the table. Each simulated pith date was drawn as a random number uniformly distributed between ![]() and
and ![]() .
.
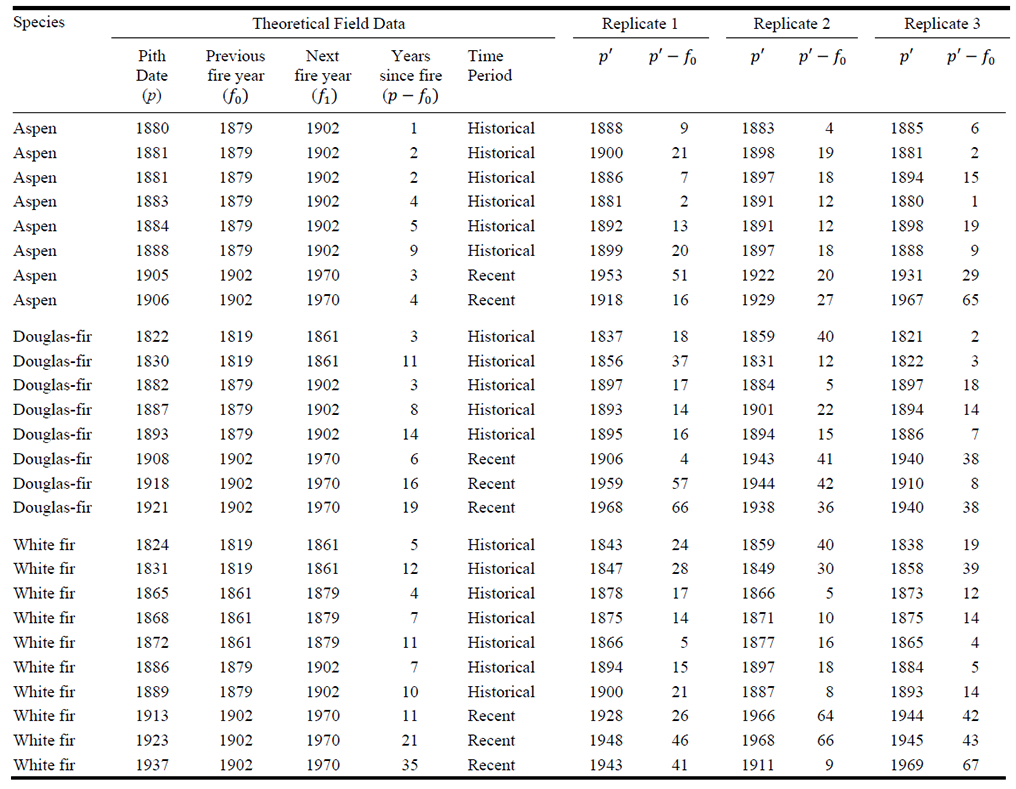
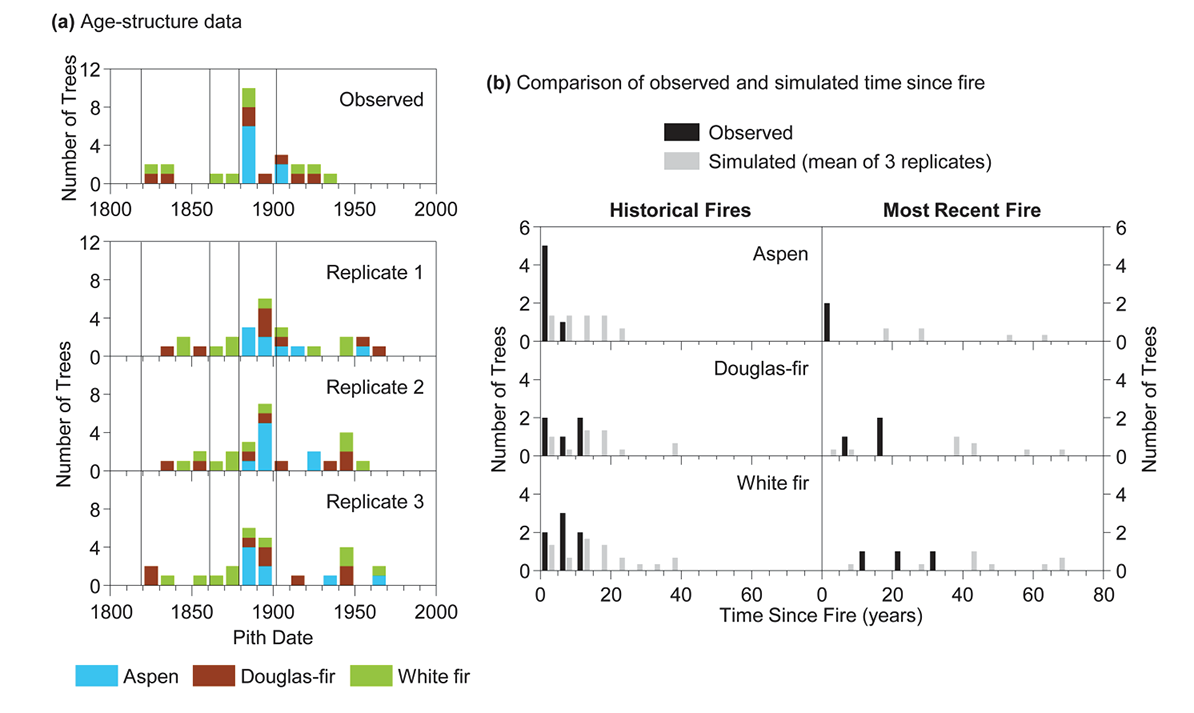
Fig. C1. Comparison of (a) the observed and simulated age-structure data based on a theoretical data set of 26 pith dates from aspen, Douglas-fir, and white fir trees with 4 fire years in the stand (vertical lines represent fire years). In (b), the observed and simulated pith dates are converted to time since fire, and the proportion of observed pith dates in each five-year bin is compared to the proportion of simulated pith dates in each bin averaged across the three replicates.