Ecological Archives M085-022-A1
Alan J. Tepley and Thomas T. Veblen. 2015. Spatiotemporal fire dynamics in mixed-conifer and aspen forests in the San Juan Mountains of southwestern Colorado, USA. Ecological Monographs 85:583603. http://dx.doi.org/10.1890/14-1496.1
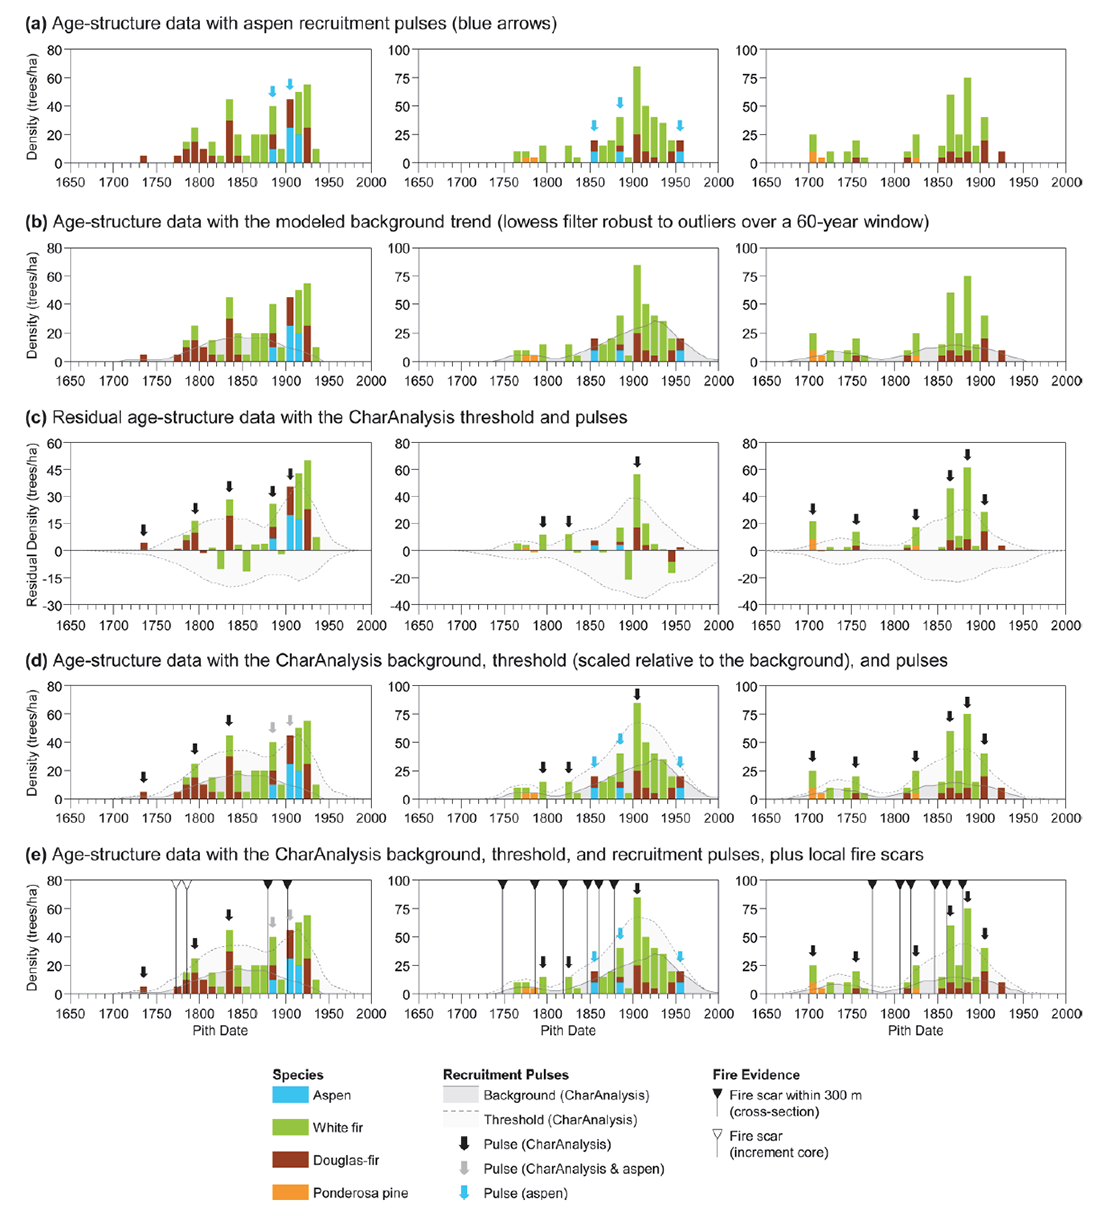
Appendix A. Peak detection in age-structure data.
OVERVIEW
The distribution of tree ages in a forest stand may be characterized by relatively abrupt pulses of recruitment in response to local disturbances superimposed on background recruitment that exhibits more gradual, lower-amplitude fluctuation in response to factors including canopy gap formation and interannual climate variation. In order to identify disturbance-initiated pulses of recruitment, we need to first model the background, non-disturbance-driven fluctuation in tree recruitment, and then set a threshold above that background variation. An abrupt increase in tree recruitment at a density exceeding that threshold is likely to represent a response to disturbance.
To accomplish this task, we applied a peak detection method (CharAnalysis 0.9; Higuera 2009) initially developed for use in constructing fire histories from charcoal accumulation in lake sediments. Similar to forest age-structure data, lake-sediment charcoal series are commonly characterized by abrupt pulses of input from local fires superimposed on slowly-varying background charcoal accumulation driven by factors such as wind-blown charcoal from distant fires, secondary charcoal transport (i.e., slopewash), or within-lake re-deposition (Higuera et al. 2010). We applied CharAnalysis to each of the 80 stands in our study area, where the input data were the density (trees/ha) of trees in each stand with pith dates in each decade, and values were summed across species.
CharAnalysis is particularly useful for age-structure data because it was developed to allow application to non-stationary time series where both the background trend and the height of local peaks above that trend may vary over time (Higuera et al. 2010). For age-structure data, variation in the background trend arises in response to factors that influence both tree recruitment and tree mortality because only those trees alive at the time of sampling are represented. The height of disturbance-initiated recruitment peaks above the background trend is likely to increase with disturbance severity, but then decrease with time since the disturbance and with the number and severity of subsequent disturbances. Peak detection by CharAnalysis is conducted independent of data on disturbances (i.e., the only input is age-structure data), and it can be applied using a locally-defined threshold that becomes more or less restrictive over the distribution of tree ages, depending on the variation in background recruitment (Higuera et al. 2010).
STEPS IN PEAK DETECTION BY CHARANALYSIS
The first step in identifying pulses of tree recruitment by CharAnalysis is to smooth the background distribution of tree ages (Fig. A1b). In the present study, we achieved this by applying a locally weighted regression that is robust to outliers (Cleveland 1979) over a 60-year window centered on each decade. Next, the smoothed background values are subtracted from the observed density of pith dates in each decade to produce a residual distribution representing high-frequency variation around the background trend (Fig. A1c). A locally-defined threshold (light shading and dashed lines in Fig. A1c) is then generated using a Gaussian mixture model that separates the residual distribution into signal and noise components over each 60-year window. The Gaussian mixture model is based on the assumption that the noise component is Gaussian with a mean near 0 and the signal component corresponds to the most extreme values of this distribution (Gavin et al. 2006). The 99th percentile of the Gaussian distribution for each 60-year window was set arbitrarily as a threshold (Higuera et al. 2010), and we labeled decades when the residual density of pith dates exceeded this threshold as recruitment pulses (Fig. A1c).
After recruitment pulses were identified, we rescaled the positive threshold in relation to the background trend to enable plotting of the background and threshold values on the original age-structure data (Fig. A1d). Note that because the noise distribution and corresponding thresholds were calculated over each 60-year window, the height of the threshold above the background trend increases with increasing variability in the noise distribution. In other words, the greater the mean and variation in the density of pith dates over a given 60-year window, the greater the density of pith dates required to qualify as a pulse of tree recruitment (Fig. A1d).
APPLICATION OF PEAK DETECTION ALGORITHMS TO SELECTED STANDS
Each step in CharAnalysis is illustrated on the age-structure data of three representative stands (Fig. A1). We also show pulses of aspen recruitment to allow for comparison of the two approaches used to identify recruitment pulses in this study, and we provide local fire scars for each stand to compare recruitment pulses to the local fire record. The steps shown in Fig. A1 are for the window width, smoothing function, and threshold-detection method we used in the present study, but other options are available to better fit local disturbance and tree recruitment dynamics in other systems (Higuera 2009). In some instances, the values of the background curve became slightly negative in the most recent few decades (i.e., after the pith date of the youngest tree per stand), and this sometimes led to the identification of peaks for decades in which no pith dates were recorded. Therefore, we excluded all peaks identified in decades when no pith dates were recorded and negative values of the background trend led to the identification of spurious peaks.
The stand in the left column of Fig. A1 includes five recruitment pulses identified by CharAnalysis, two of which were also identified by aspen recruitment (Fig. A1e). The two pulses identified by both methods (1880s and 1900s) were initiated shortly after fire-scar dates (1879 and 1902) found on samples within 300 m of the transect and on several additional samples in the study area. The 1790s pulse identified by CharAnalysis was initiated shortly after the dates of two healed-over fire scars found on increment cores within the stand (1773 and 1786). Both of these scar years were also found on several partial cross-sections in nearby stands (see Appendix D). The recruitment pulse in the 1830s did not correspond to fire scars within 300 m of the stand, but a fire scar in 1836 was found in the adjacent stand and in several nearby stands.
The stand in the middle column of Fig. A1 includes three recruitment pulses identifed by CharAnalysis and three additional pulses identified by aspen recruitment (Fig. A1e). In this stand, a high density of trees with pith dates from the mid-19th to the mid-20th century led to relatively high values for the background and threshold for identifying pulses by CharAnalysis. As a result, the increased aspen recruitment in the 1850s and 1880s did not exceed the threshold for peak detection by CharAnalysis. However, these pulses of aspen recruitment were initiated shortly after two fire scars within 300 m of the transect (1847 and 1879), which were among the years with the largest number of fire scars recorded in the study area. Also, the large recruitment pulse in the 1900s corresponded to a fire scar in 1899 found <1 km directly downslope from this transect and in several other samples in the study area.
In the stand in the right column of Fig. A1, most pulses of recruitment identified by CharAnalysis were initiated shortly after fire-scar dates found within 300 m of the transect. These fire years were recorded on numerous additional samples in the study area.
COMPARISON TO OTHER APPROACHES
Other studies have used a rule-based approach to determine whether or not disturbance-initiated recruitment peaks, or cohorts, were present in a stand, and then they used the presence or absence of such cohorts to infer fire severity (Heyerdahl et al. 2012, O’Connor et al. 2014). However, such approaches typically do not account for non-stationarity in the height of recruitment peaks above background variation in tree recruitment, where a cohort initiated early in the record might not be preserved over subsequent fires. For instance, Heyerdahl et al. (2012) identified cohorts based on the following rule: establishment of 5 trees within a 20-year window preceded by a 30-year period in which no trees established. Thus, a stand would have a post-fire cohort if fire severity was sufficient to kill all trees <30 years old and the fire opened the canopy enough that 5 trees established within the sampled area over the next 20 years. However, if the same stand burned again and some of the trees that established in the 20-year window following the first fire were killed in the next fire, the initial post-fire cohort would no longer qualify as a cohort. An approach that accounts for non-stationarity in background recruitment and the height of the threshold above that background variation might be better suited for identifying multiple cohorts in stands subject to multiple fires of varying severity.
Rule-based approaches also commonly require prior identification of disturbance events, for instance, by setting a threshold of >20% of the sampled trees within a stand establishing within a 40-year window following a previously-identified fire year (Schoennagel et al. 2011). Such an approach is useful in evaluating responses to known disturbances (e.g., when a fire scars are readily available in each sampled stand), but the use of disturbance events to identify recruitment pulses depends on the assumption that the recruitment was initiated by the disturbance. By contrast, the identification of recruitment pulses independent of the disturbance record in the present study enabled us to evaluate whether those pulses were synchronous among multiple stands, and if so, it allowed us to assess what was the main driver of the synchronous recruitment (see Fig. 3 of the main text).
Fig. A1. Illustration of the analysis steps for identifying pulses of tree recruitment by CharAnalysis (Higuera 2009). Age-structure data for three stands are provided in (a), where each column represents one stand and blue arrows indicate pulses of aspen recruitment. Smoothed background recruitment is provided in (b), and the residual distribution of tree ages with thresholds and pulses of recruitment are shown in (c). In (d), the positive threshold is rescaled relative to the background. The background, threshold, and recruitment pulses are plotted in relation to the initial distribution of tree ages and local fire-scar data in (e).
Literature cited
Cleveland, W.S. 1979. Robust locally weighted regression and smoothing scatterplots. Journal of the American Statistical Association 74:829–836.
Gavin, D.G., F.S. Hu, K. Lertzman, and P. Corvett. 2006. Weak climatic control of stand-scale fire history during the late Holocene. Ecology 87:1722–1732.
Heyerdahl, E.K., K. Lertzman, and C.M. Wong. 2012. Mixed-severity fire regimes in dry forests of southern interior British Columbia, Canada. Canadian Journal of Forest Research 42:88–98.
Higuera, P.E. 2009. CharAnalysis 0.9: Diagnostic and analytical tools for sediment-charcoal analysis. http://CharAnalysis.googlepages.com.
Higuera, P.E., D.G. Gavin, P.J. Bartlein, and D.J. Hallett. 2010. Peak detection in sediment-charcoal records: impacts of alternative data analysis methods on fire-history interpretations. International Journal of Wildland Fire 19:996–1014.
O’Connor, C.D., D.A. Falk, A.M. Lynch, and T.W. Swetnam. 2014. Fire severity, size, and climate associations diverge from historical precedent along an ecological gradient in the Pinaleño Mountains, Arizona, USA. Forest Ecology and Management 329:264–278.
Schoennagel, T.L., R.L. Sherriff, and T.T. Veblen. 2011. Fire history and tree recruitment in the Colorado Front Range upper montane zone: implications for forest restoration. Ecological Applications 21:2210–2222.