Ecological Archives M085-015-A9
Chengjin Chu and Peter B. Adler. 2015. Large niche differences emerge at the recruitment stage to stabilize grassland coexistence. Ecological Monographs 85:373392. http://dx.doi.org/10.1890/14-1741.1
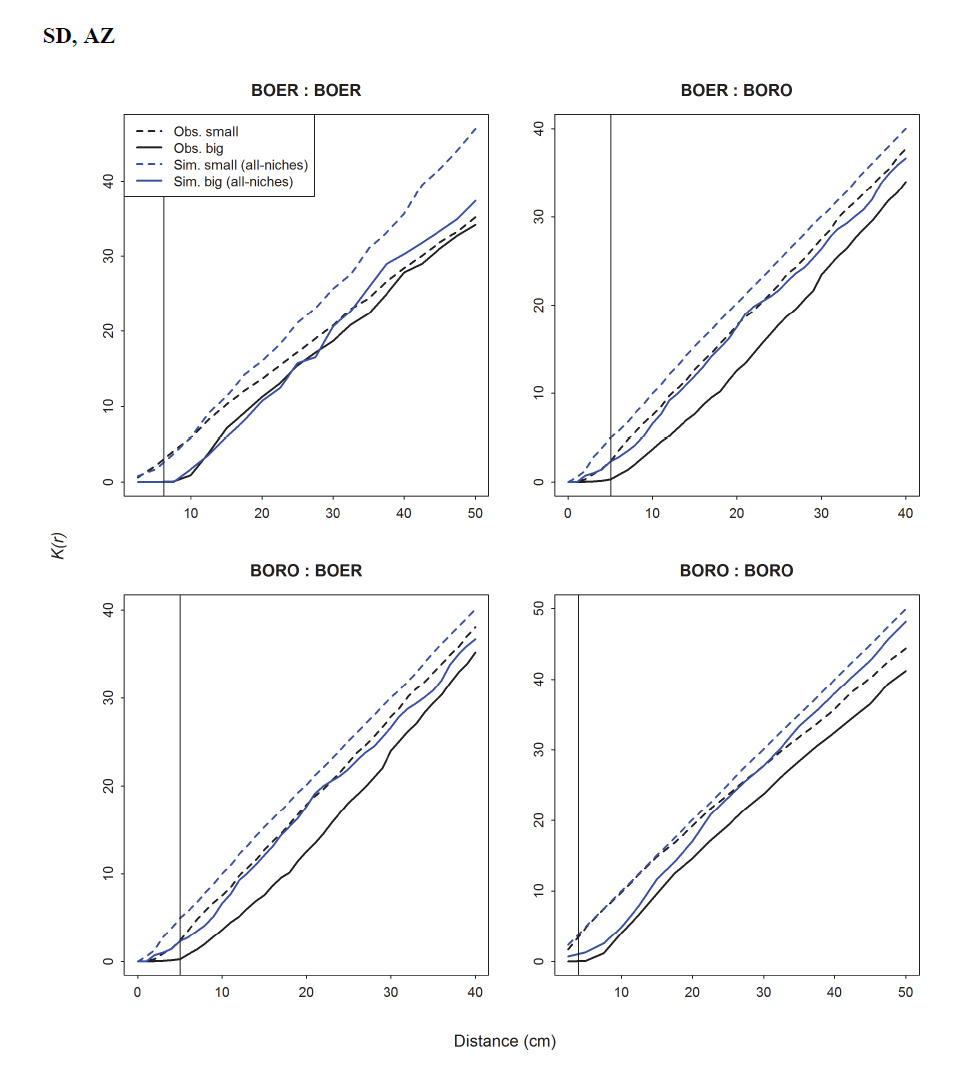
Appendix I. Observed and simulated spatial patterns.
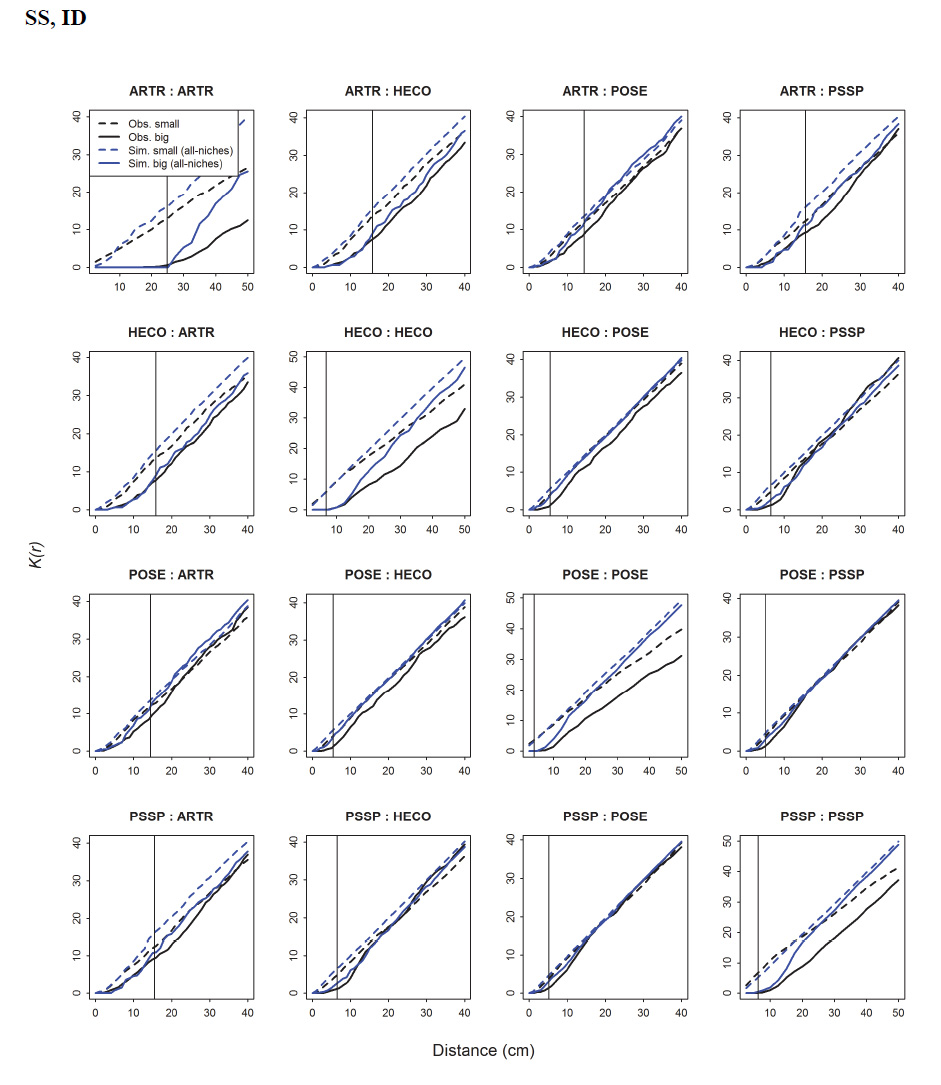
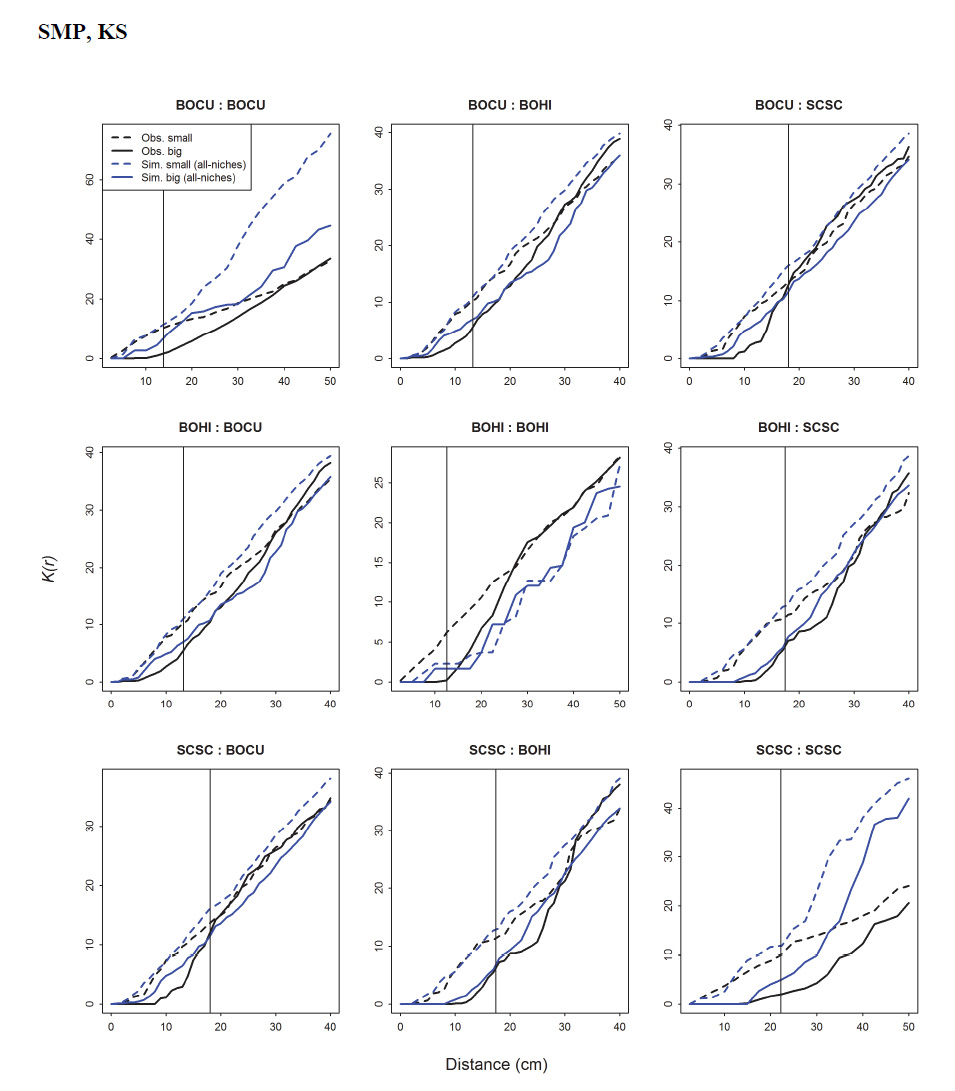
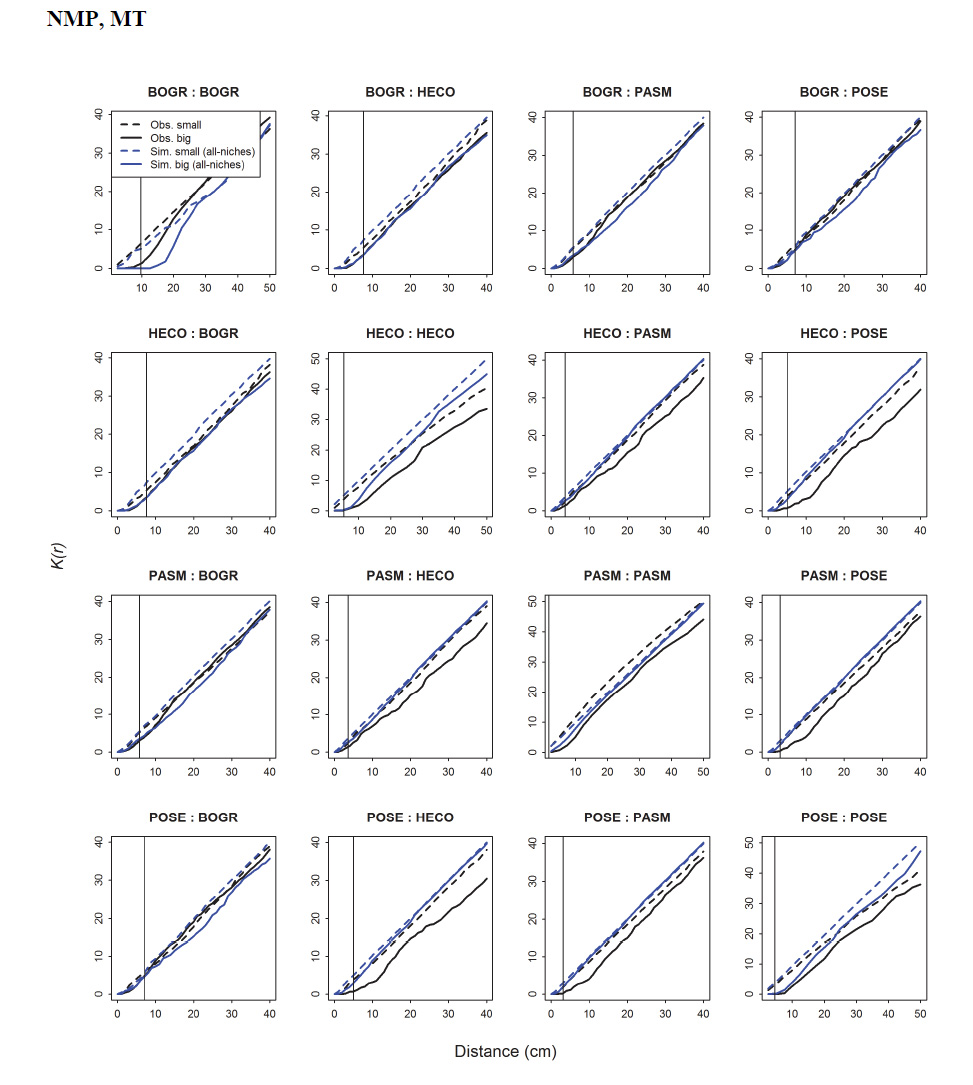
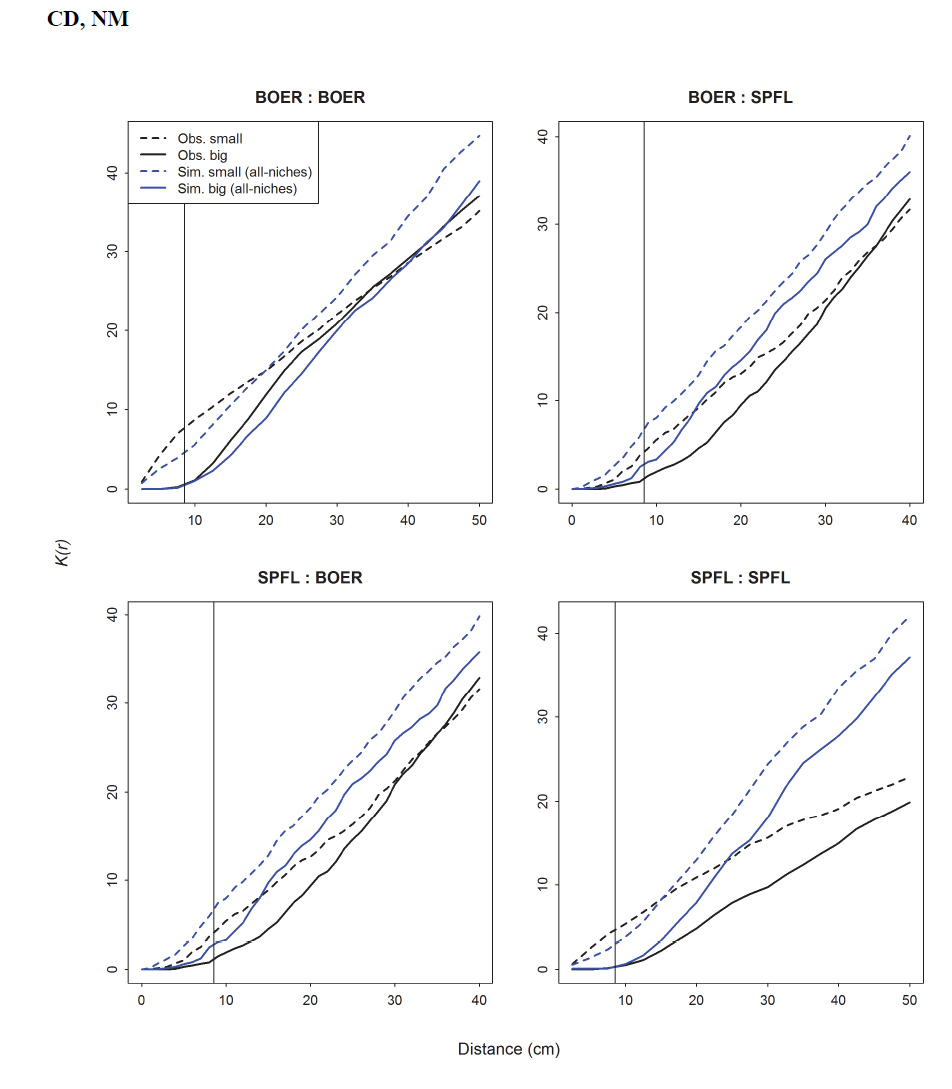
K(r) measures the cumulative density of individuals of neighboring species as a function of distance from individuals of the focal species. It is scaled so that the 1:1 line represents a random distribution, values below the 1:1 line represent over-dispersed patterns, and values above the 1:1 line show aggregated patterns. In the title of each panel, the focal species is listed first, and the neighbor species second. Solid lines show spatial associations among large genets (upper 33% of the size distribution) and dashed lines show spatial associations among small genets (lower 33% of the size distribution). In both the observed data (black lines) and simulations of the all-niche IBM (blue lines), patterns are random for interspecific comparisons and small genets, but comparisons of large conspecific genets show evidence of over-dispersion. Specifically, K(r) is near zero at distances less than the mean diameter of large genets, shown by the vertical lines. See the section Summary of study sites and species selection in Materials and Methods for the abbreviations for species names.