Ecological Archives M085-015-A3
Chengjin Chu and Peter B. Adler. 2015. Large niche differences emerge at the recruitment stage to stabilize grassland coexistence. Ecological Monographs 85:373392. http://dx.doi.org/10.1890/14-1741.1
Appendix C. The effect of positive interactions on community dynamics.
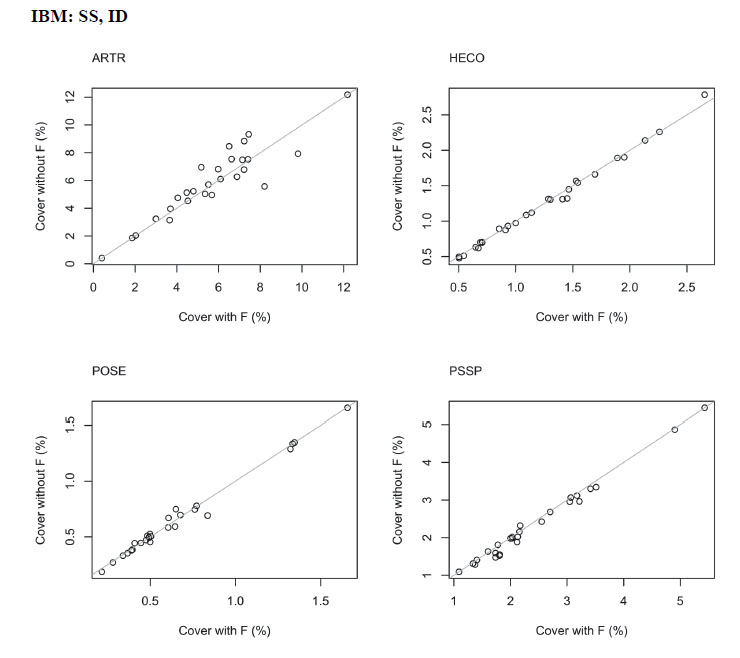
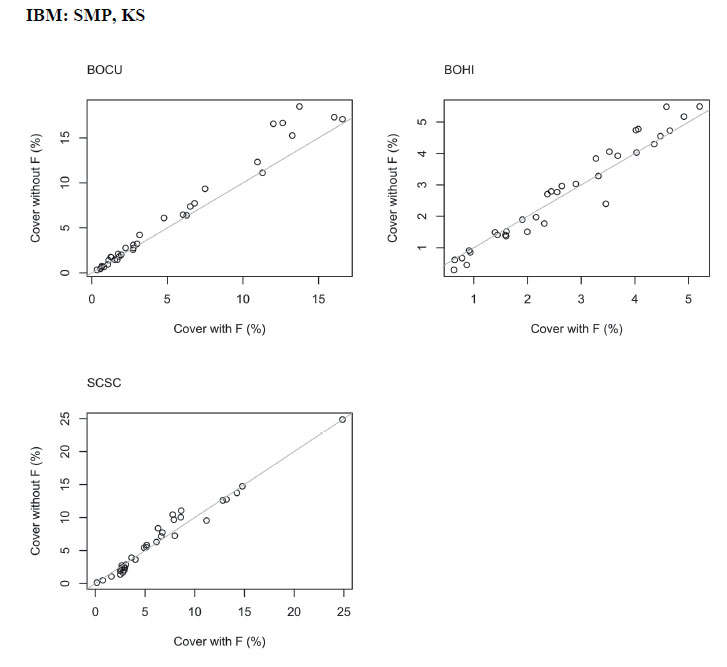
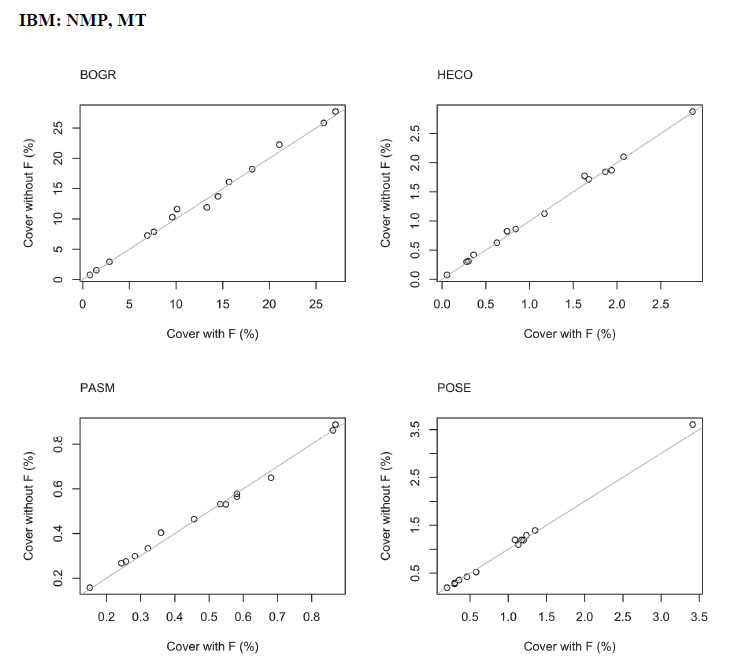
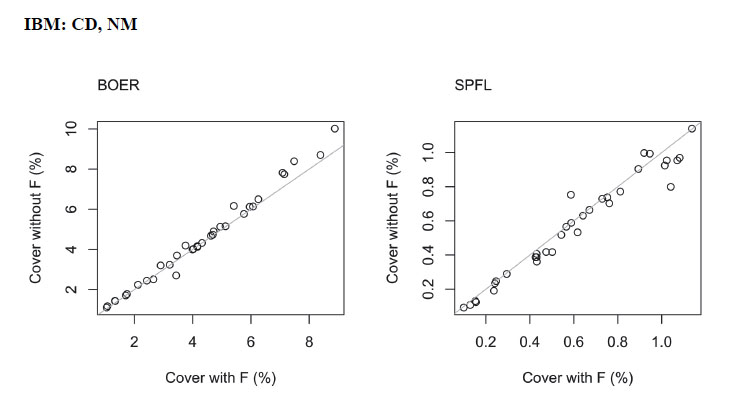
The Figs. C1 to C5 show comparisons of yearly cover reproduced from IBM models with and without positive interactions, and the Figs. C6 to C10 show comparisons of species’ equilibrium cover simulated by IPM models with and without positive interactions. We fit models without positive interactions by fitting vital rate models with informative priors in a Bayesian computational framework. See the section Summary of study sites and species selection in Materials and Methods for the abbreviations for species names.
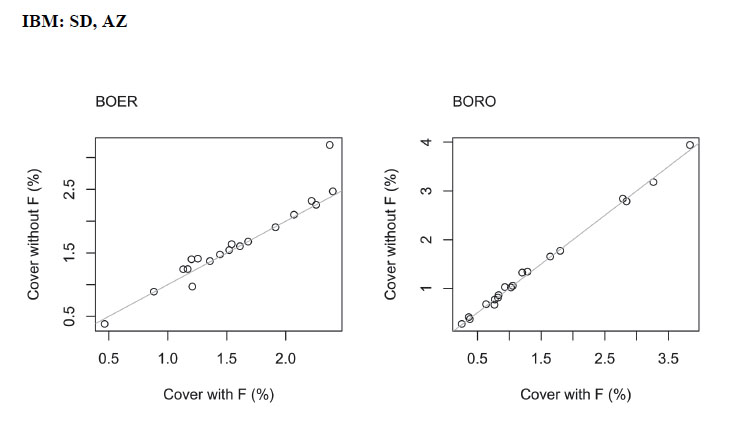
IBM: Reproduced the yearly cover
In Figs. C1 to C5, the x-axis is for the yearly cover predicted from IBM models allowing for positive interactions, and the y-axis is for the yearly cover predicted from the ones excluding positive interactions. The gray line in each figure represents the 1:1 line. ‘F’ in the label text means ‘Facilitation’ (i.e., positive interactions).
The results indicate that models with and without positive interactions reproduced pretty similar cover across years.
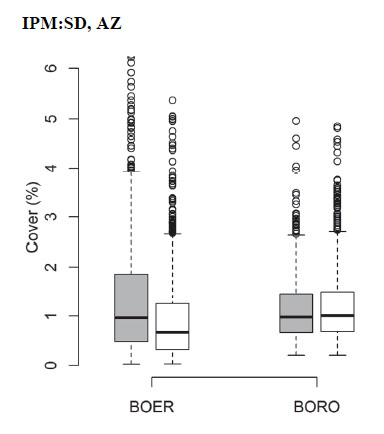
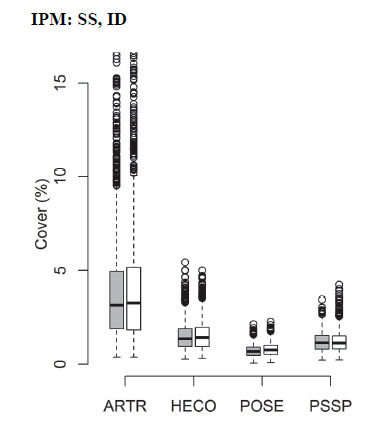
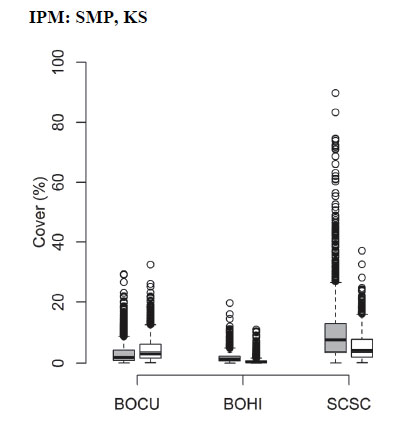
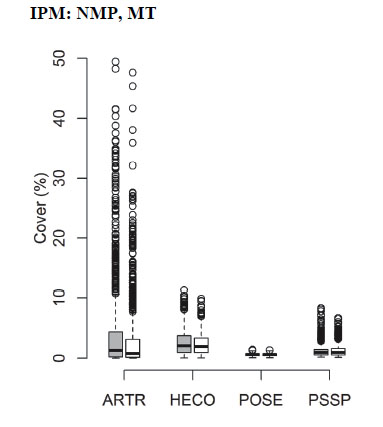
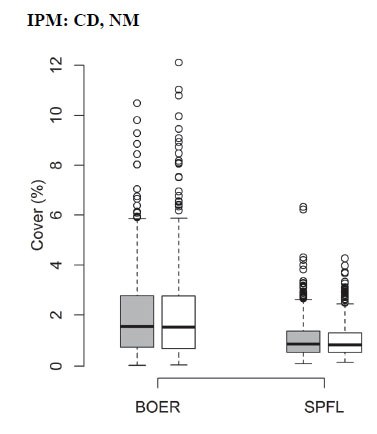
IPM: Simulated the equilibrium cover
In Figs. C6 to C10, the gray bars show results for models excluding positive interactions in vital rates, and the white bars show results for models including positive interactions in vital rates. The box corresponds to the 25th and 75th percentiles, the dark line inside the box represents the median of the data (50% of the individuals), error bars are the minimum and maximum except for outliers (circle points corresponding to values beyond 1.5 times the interquartile range). The variation on equilibrium cover comes from the random temporal year effects.
The equilibrium cover is not always higher in models with positive interactions. However, the model simulations which exclude positive interactions still do a good job of representing the observed community.
Fig. C1.
Fig. C2.
Fig. C3.
Fig. C4.
Fig. C5.
Fig. C6.
Fig. C7.
Fig. C8.
Fig. C9.
Fig. C10.