Ecological Archives M085-003-A1
N. Evangeliou, Y. Balkanski, A. Cozic, W. M. Hao, F. Mouillot, K. Thonicke, R. Paugam, S. Zibtsev, T. A. Mousseau, R. Wang, B. Poulter, A. Petkov, C. Yue, P. Cadule, B. Koffi, J. W. Kaiser, and A. P. Møller. 2015. Fire evolution in the radioactive forests of Ukraine and Belarus: future risks for the population and the environment. Ecological Monographs 85:4972. http://dx.doi.org/10.1890/14-1227.1
Appendix A. Figures showing variation of the boundary layer height (m) in the Ukrainian and Belarusian contaminated forests between 2002 and 2010, continental distribution of BA, TC, and TPM for Europe from the GFED3 database, forest tree-cover from Kempeneers et al. (2011) database at 1 km resolution and aggregated at 0.5° resolution for comparison with the GFED3 database, forest cover change around the ChNPP derived from Landsat images from 1987 and 2010 and forest-cover change over the ChNPP from Hansen et al. (2013), biomass burning in Chernobyl as seen from PKU-FUEL model of the Peking University, and prediction of the litter carbon stock and fire occurrence until 2100 calculated from the LPJmL-SPITFIRE model for Europe, Belarus, and Chernobyl.
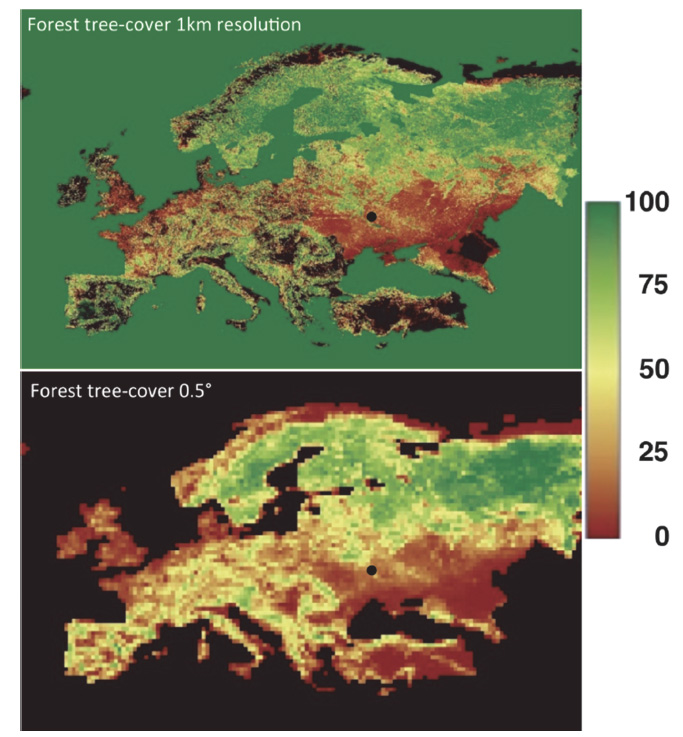
Fig. A1. Forest tree-cover from Kempeneers et al. (2011) database at 1 km resolution (upper panel) and aggregated at 0.5° resolution (lower panel) for comparison with the GFED database. The black dot indicates the ChNPP.
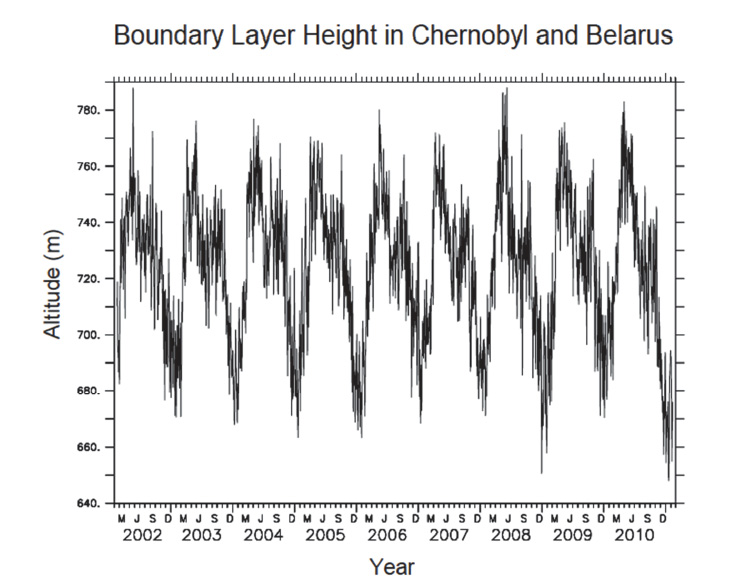
Fig. A2. Variation of the Boundary Layer Height (m) in the Ukrainian and Belarusian contaminated forests between 2002 and 2010 where large fires occurred. The values are averages for longitudes between 20ºE–40ºE and latitudes between 40ºN–60ºN (ECMWF 2002).
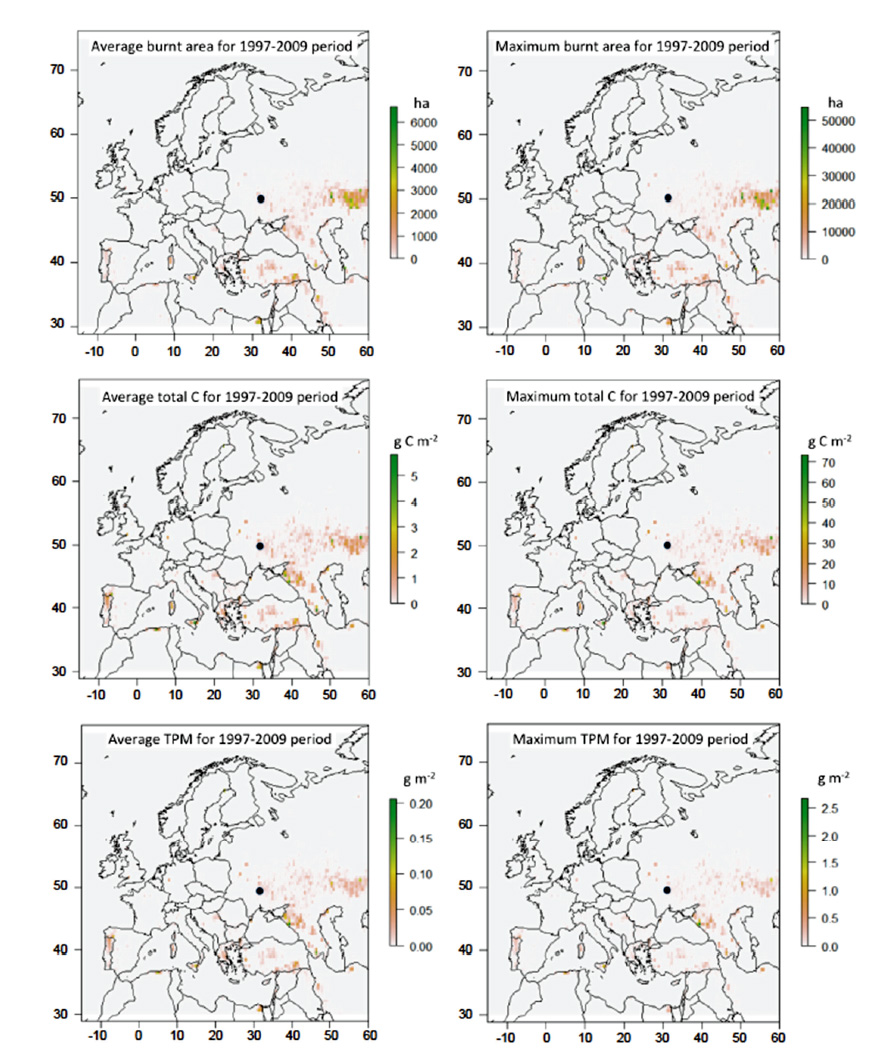
Fig. A3. Continental distribution of BA, TC, and TPM for Europe from the GFEDv3.1 database.
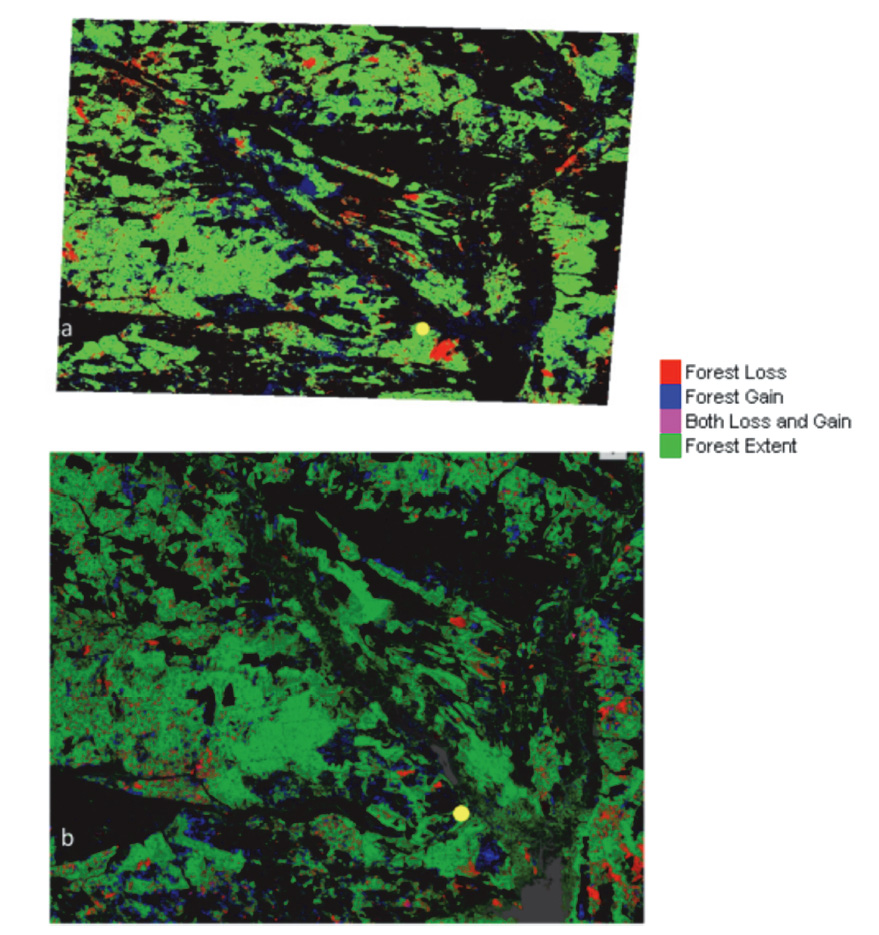
Fig. A4. (a) Forest cover change around the ChNPP derived from Landsat images from 1987 and 2010. (b) Forest-cover change over the ChNPP from Hansen et al. (2013).
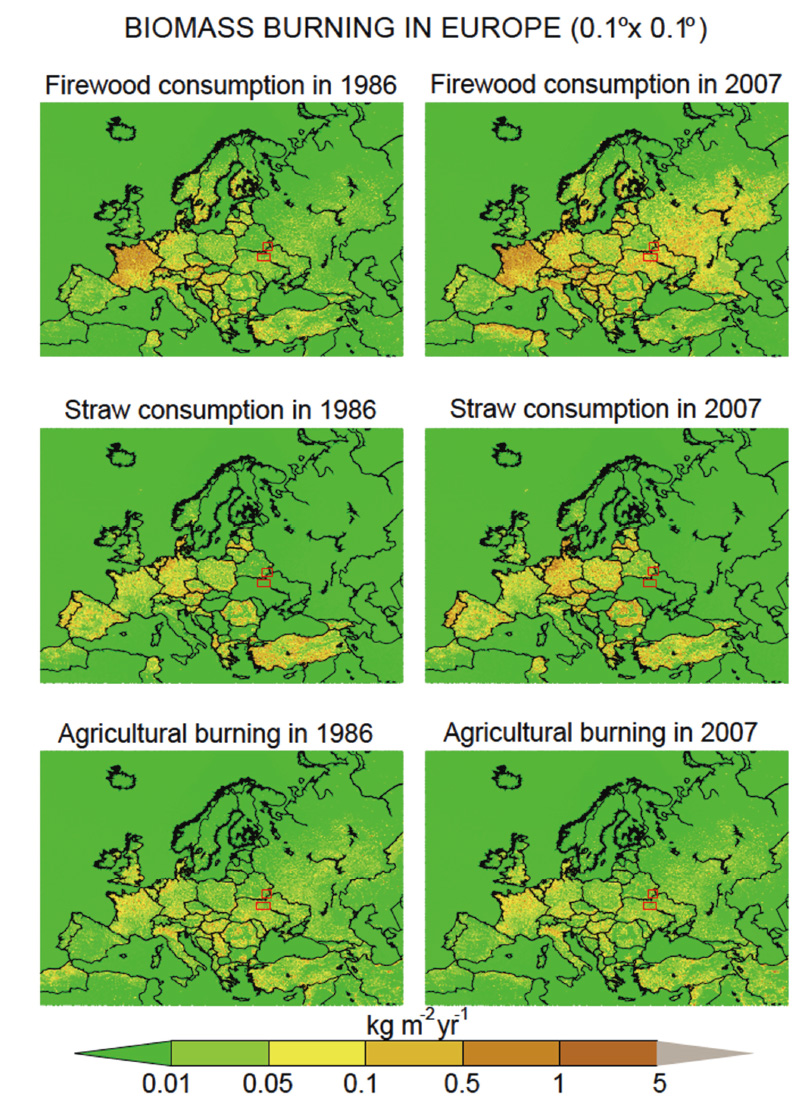
Fig. A5. Biomass burning in Chernobyl as seen from PKU-FUEL model of the Peking University. Years 1986 and 2007 are shown, in order to certify the temporal variation in the consumption of firewood, straw, as well as fires of agricultural origin. Red rectangles denote the contaminated forests of Ukraine and Belarus.
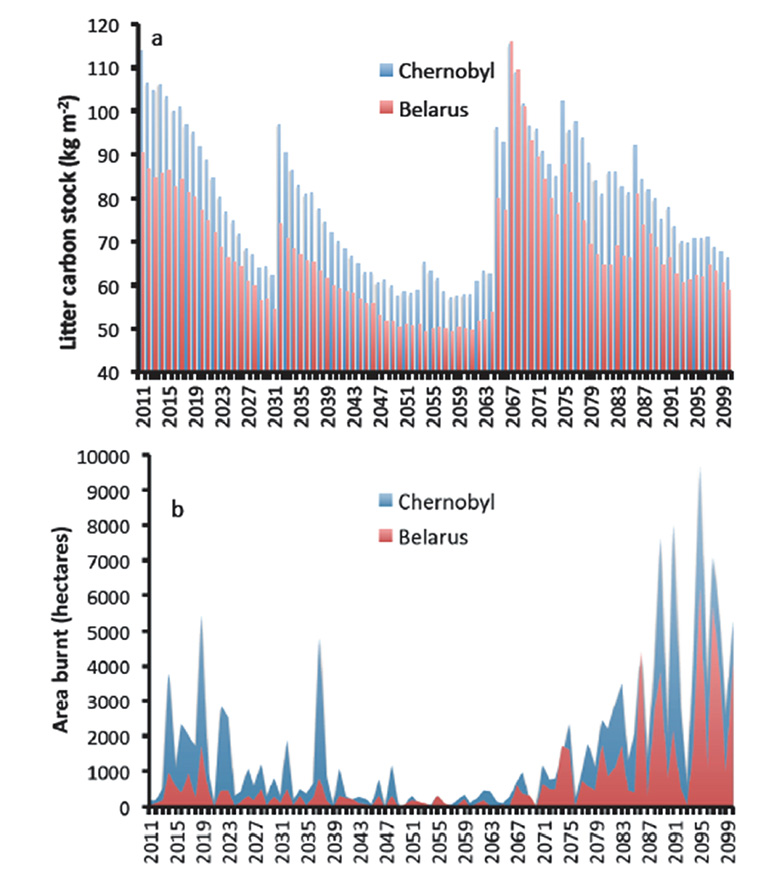
Fig. A6. Prediction of the litter carbon stock (g C/m²) and fire occurrence (area burned (ha)) until 2100 calculated from the LPJmL-SPITFIRE model for Europe, Belarus and Chernobyl (average values over the defined regions of interest).
Literature cited
European Centre for Medium-range Weather Forecasts (ECMWF). 2002. ERA-40, forty-year European re-analysis of the global atmosphere. http://www.ecmwf.int/products/data/archive/descriptions/e4.
Hansen, M. C., P. V. Potapov, R. Moore, M. Hancher, S. A. Turubanova, A. Tyukavina, D. Thau, S. V. Stehman, S. J. Goetz, T. R. Loveland, A. Kommareddy, A. Egorov, L. Chini, C. O. Justice, and J. R. G. Twonshend. 2013. High resolution global maps of 21st century forest cover change. Science 342:850–853.
Kempeneers, P., F. Sedano, L. Seebach, P. Strobl, and J. San-Miguel-Ayanz. 2011. Data fusion of different spatial resolution remote sensing images applied to forest type mapping. IEEE Transactions on Geoscience and Remote Sensing 49:4977–4986.