Ecological Archives M085-002-A2
Audrey Valls, Marta Coll, and Villy Christensen. 2015. Keystone species: toward an operational concept for marine biodiversity conservation. Ecological Monographs 85:2947. http://dx.doi.org/10.1890/14-0306.1
Appendix B. Example of the Ecopath model of the Prince William Sound (1994–1996).
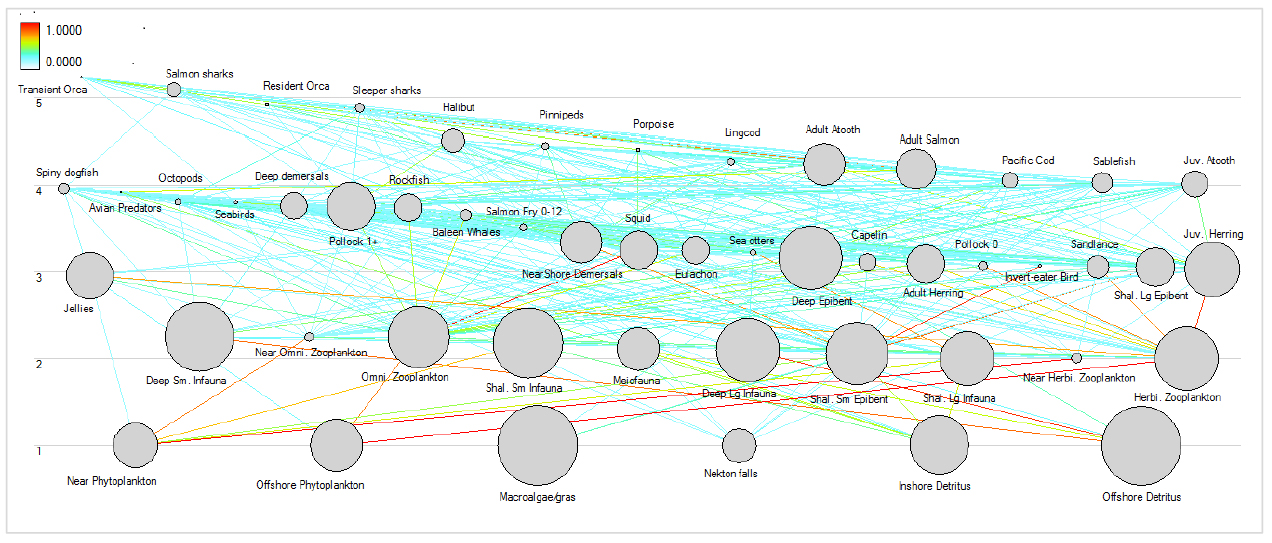
The Ecopath model representing the Prince William Sound between 1994 and 1996 comprises 48 living groups, plus three dead groups, as well as three fleets representing commercial, recreational and subsidence fisheries (Okey and Pauly 1999). Two graphical representations of the Prince William Sound (1994-1996) food web are given: the flow diagram, representing the biomass and trophic flows of the functional groups (Fig. B1), and the MTI plot, representing the relative mixed trophic impact of the functional groups and fishing fleets (Fig. B2).
Fig. B1. Flow diagram of the Prince William Sound (1994–1996) food web (Okey and Pauly 1999). Each functional group is represented with a gray node, whose size is proportional to the biomass of the group. Trophic flows between groups are represented with lines, with a color scale ranging from 0 to 1. Flows enter a node on its lower part, and exit it from the upper part. The names of the functional groups are indicated next to each node. Functional groups are distributed on the y-axis according to their estimated trophic level.
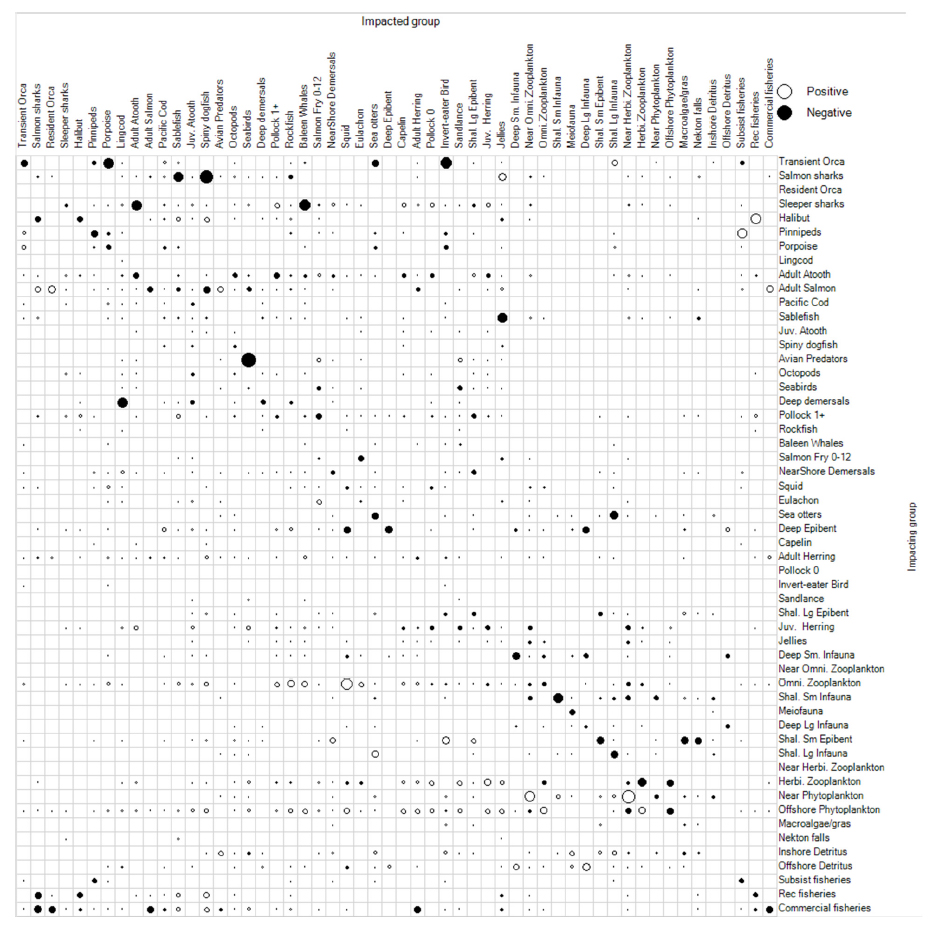
Fig. B2. Mixed Trophic Impact plot of the Prince William Sound (1994–1996) food web (Okey and Pauly 1999). Each functional group is represented as an impacted group in columns, and as an impacting group in rows. A white circle indicates a positive mixed trophic impact of the impacting group on the impacted one, while a black circle indicates a negative mixed trophic impact. The size of the circles is proportional to the importance of the relative impact, ranging from 0 to 1. Fishing fleets are represented in the same way as functional groups.
Literature cited
Okey, T. A., and D. Pauly. 1999. Trophic mass-balance model of Alaska's Prince William Sound ecosystem, for the post-spill period 1994–1996. University of British Columbia, Vancouver, Canada.