Ecological Archives C006-105-A2
Ekananda Paudel, Gbadamassi G. O. Dossa, Marleen D. de Blécourt, Philip Beckschäfer, Jianchu Xu, and Rhett D. Harrison. 2015. Quantifying the factors affecting leaf litter decomposition across a tropical forest disturbance gradient. Ecosphere 6:267. http://dx.doi.org/10.1890/es15-00112.1
Appendix B. Microclimate.
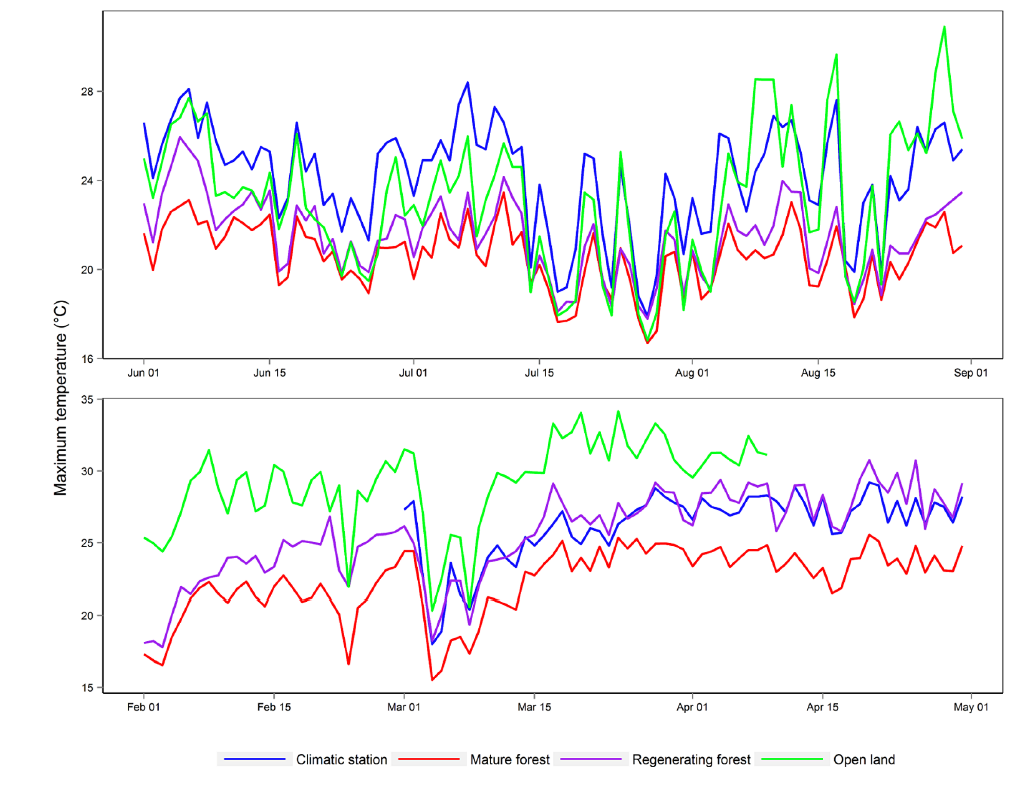
Fig. B1. Daily maximum air temperature from the climate station and microclimate stations in different forest types along the landscape during wet season 2012 (top row) and dry season 2013 (bottom row).
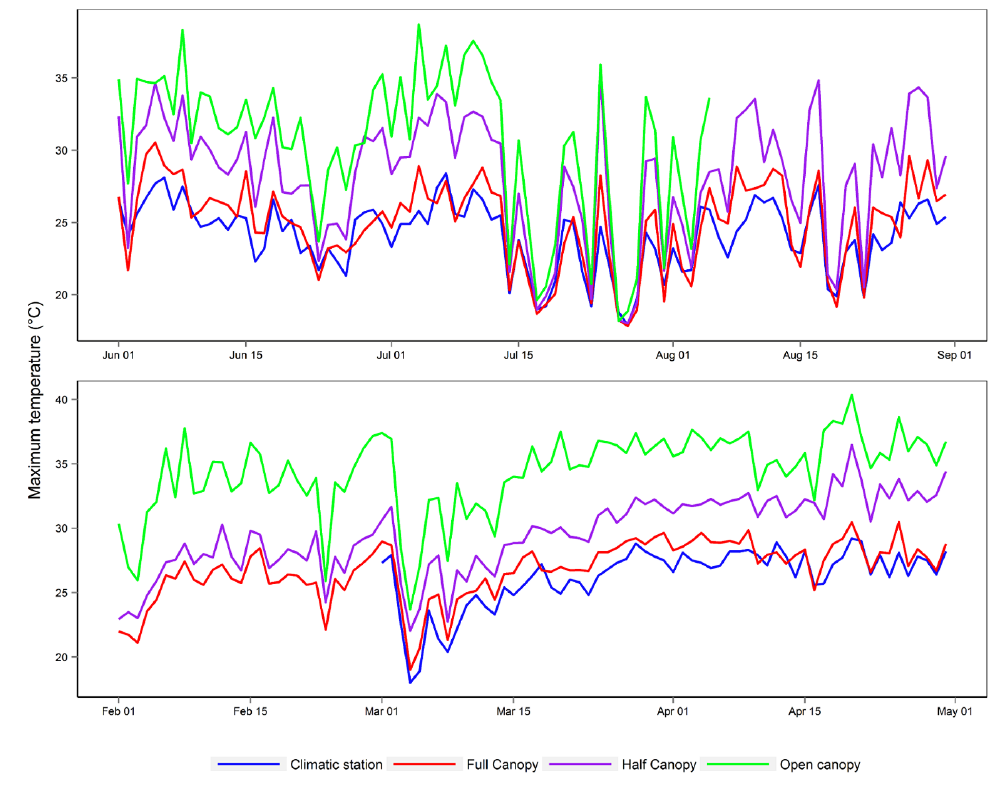
Fig. B2. Daily maximum air temperature from the climate station and microclimate stations in canopy treatments from full canopy to open canopy during wet season 2012 (top row) and dry season 2013 (bottom row).
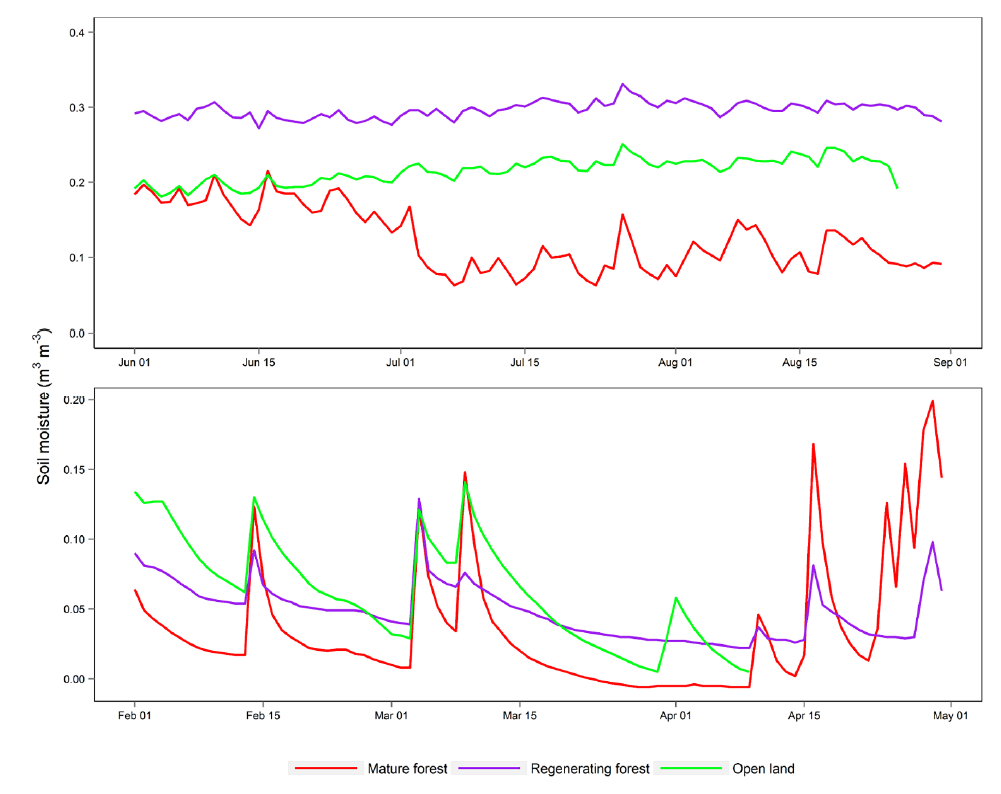
Fig. B3. Daily average soil moisture in different forest types across the landscape during wet season 2012 (top row) and dry season 2013 (bottom row).
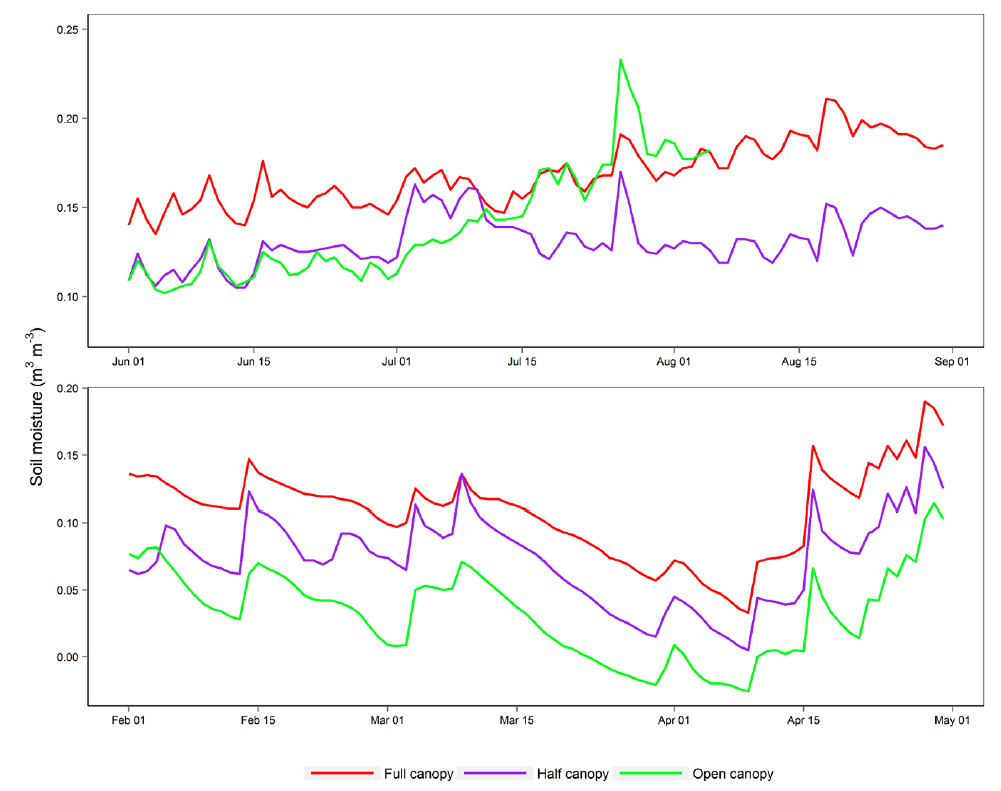
Fig. B4. Daily average soil moisture along canopy treatments along canopy treatments from full canopy to open canopy during wet season 2012 (top row) and dry season 2013 (bottom row).
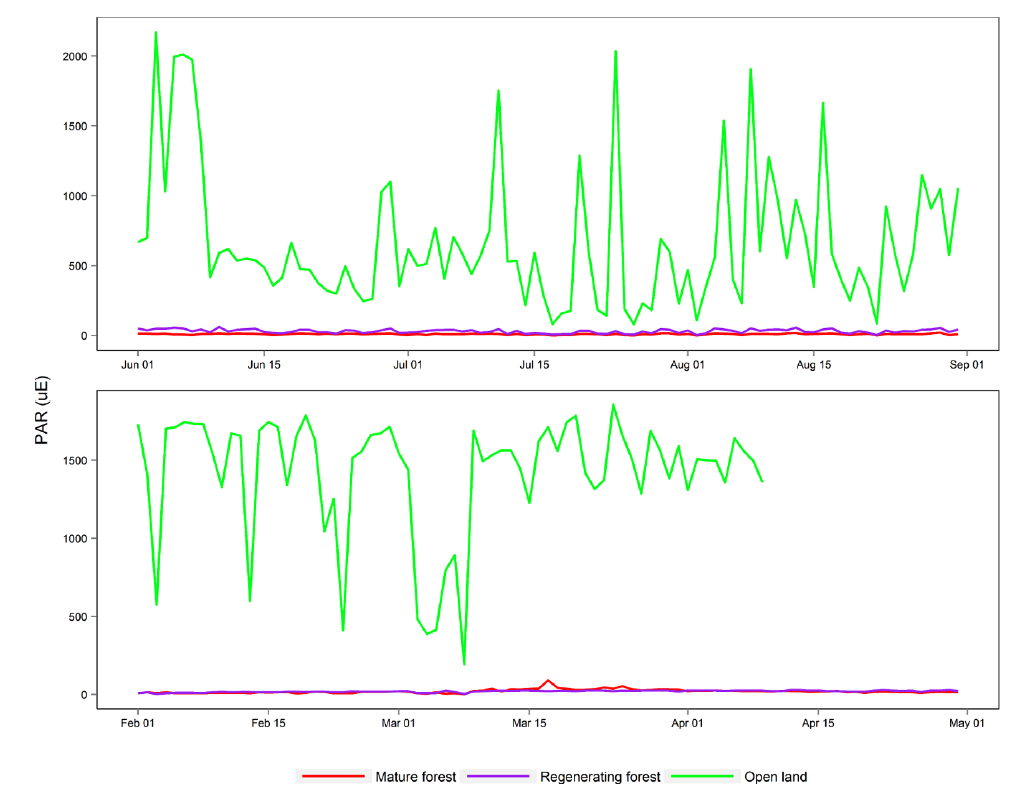
Fig. B5. Daily median PAR (median was calculated only from 2 solar noon hours) in different forest types across the landscape during wet season 2012 (top row) and dry season 2013 (bottom row).
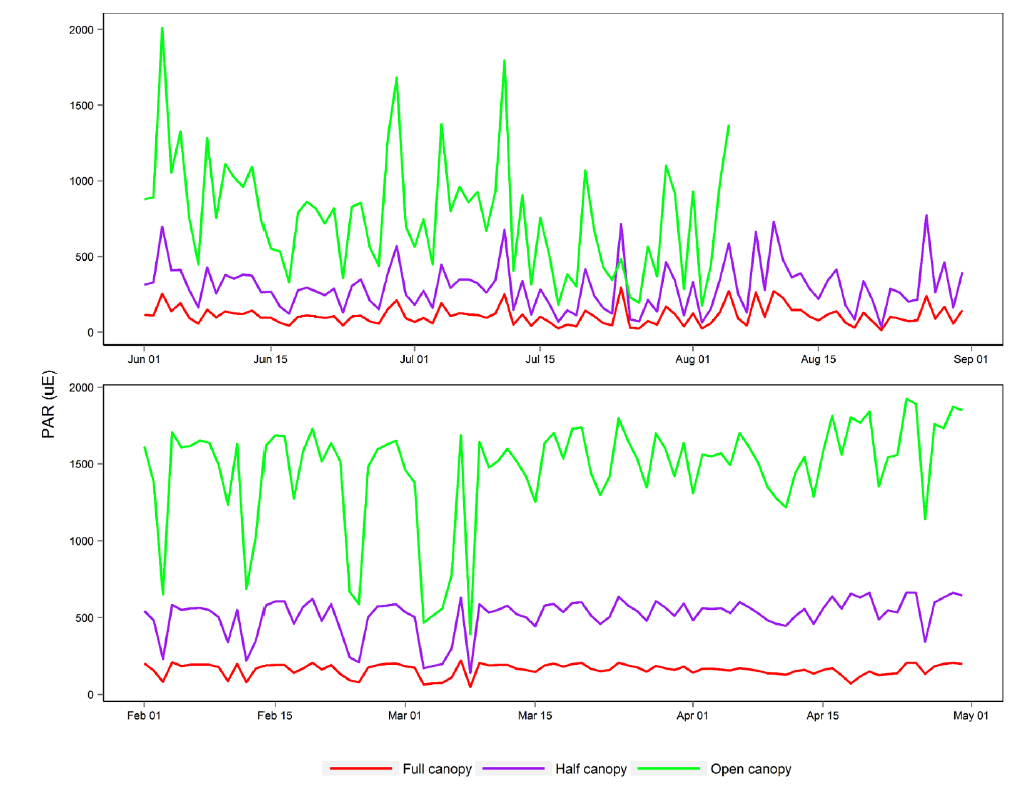
Fig. B6. Daily median PAR (median was calculated from only 2 solar noon hours) along canopy treatments from full canopy to open canopy during wet season 2012 (top row) and dry season 2013 (bottom row).
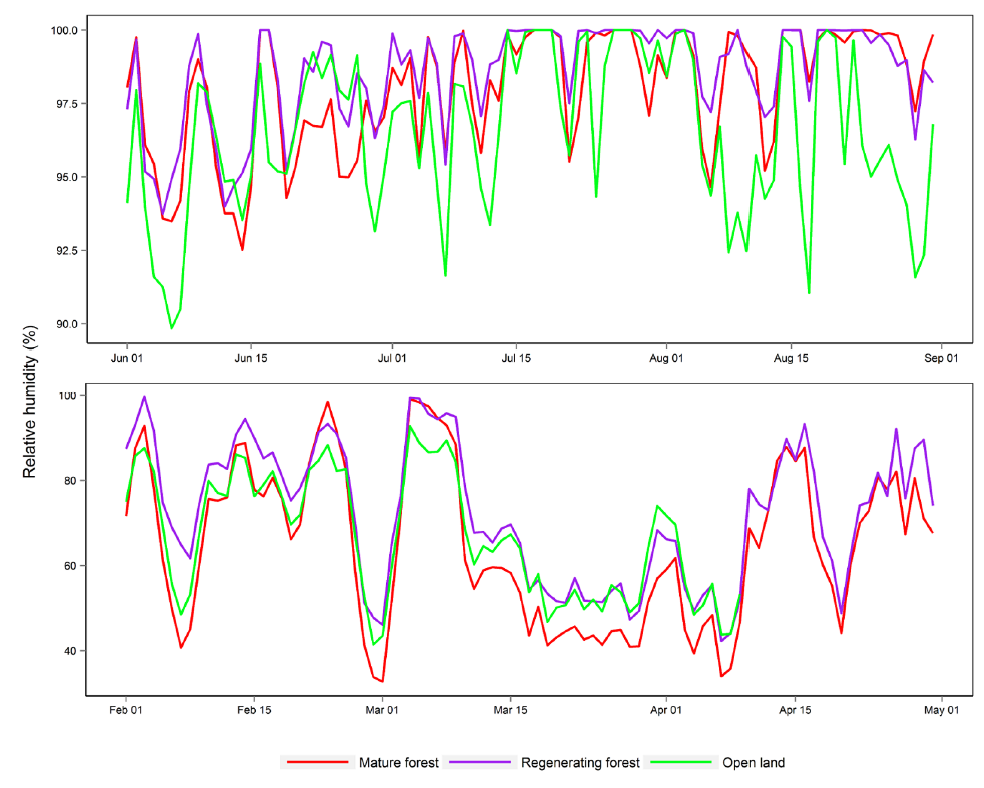
Fig. B7. Daily average relative humidity in different forest types across the landscape during wet season 2012 (top row) and dry season 2013 (bottom row).
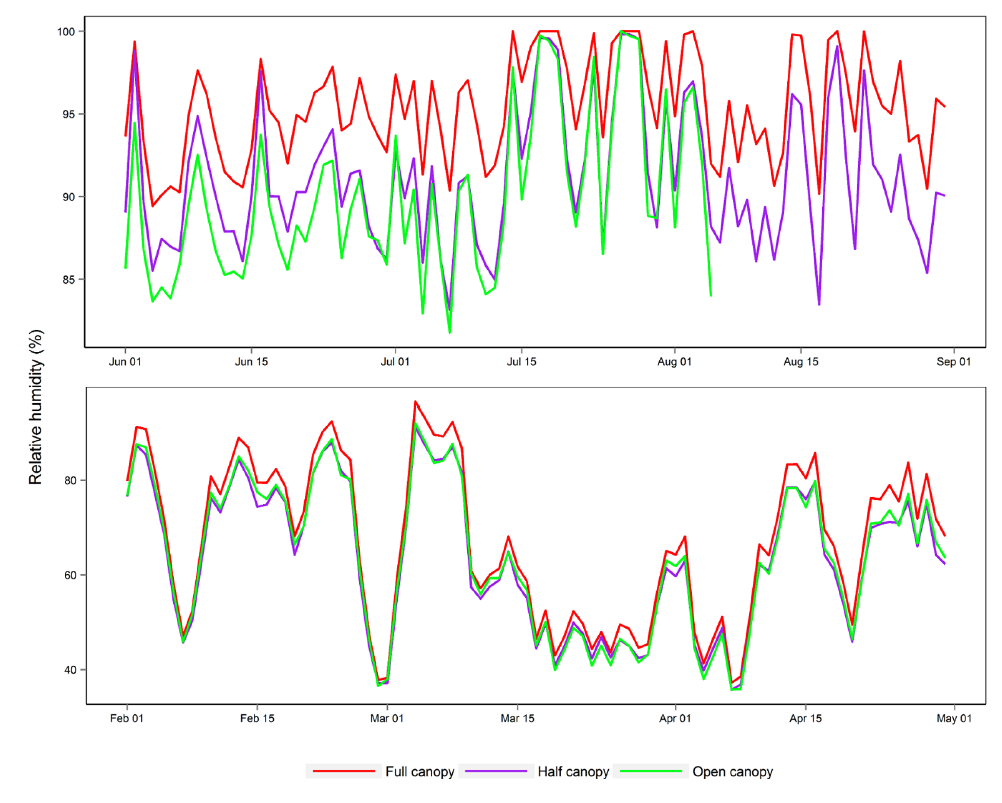
Fig. B8. Daily average relative humidity along canopy treatments from full canopy to open canopy during wet season 2012 (top row) and dry season 2013 (bottom row).