Ecological Archives C006-101-A1
Douglas J. Tempel, R. J. Gutiérrez, John J. Battles, Danny L. Fry, Yanjun Su, Qinghua Guo, Matthew J. Reetz, Sheila A. Whitmore, Gavin M. Jones, Brandon M. Collins, Scott L. Stephens, Maggi Kelly, William J. Berrigan, and M. Zachariah Peery. 2015. Evaluating short- and long-term impacts of fuels treatments and simulated wildfire on an old-forest species. Ecosphere 6:261. http://dx.doi.org/10.1890/es15-00234.1
Appendix A. Accuracy assessment of pre- and post-treatment vegetation maps.
We conducted an accuracy assessment of the 2008 pre-treatment and 2013 post-treatment vegetation maps for the Last Chance Study Area to determine how well the maps represented canopy cover and large tree density, which were the two components of forest structure that we used to characterize California Spotted Owl (Strix occidentalis occidentalis) nesting habitat. First, we used ArcGIS 10.1 to overlay the network of field-based vegetation plots (see Materials and methods: Development of vegetation map) on the vegetation map and identify each map polygon that contained at least one vegetation plot within its boundary. For the pre-treatment map, 286 map polygons contained one field plot, 37 contained two field plots, and 11 contained more than two field plots (maximum was seven). For the post-treatment map, 271 map polygons contained one field plot, 25 contained two field plots, and 13 contained more than two field plots (maximum was five). For each of these polygons, we then compared the values for canopy cover (percent) and large tree density (number of trees ≥71.3 cm dbh per hectare) indicated by the map with the average values of these metrics from all vegetation plots within the polygon.
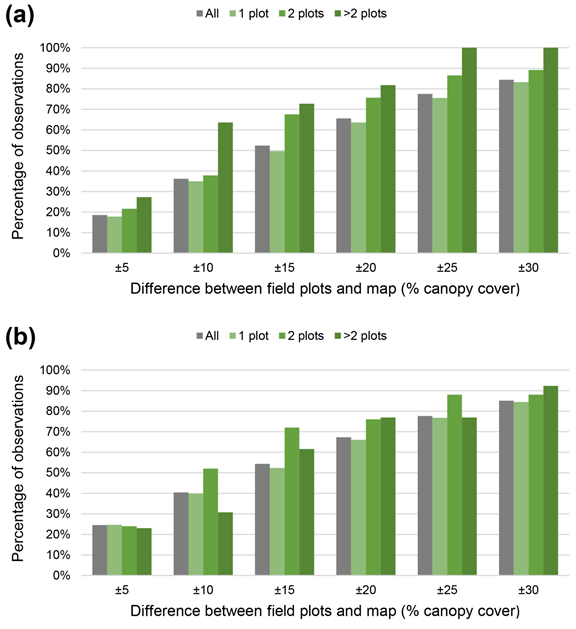
For canopy cover, the field plot and map values were similar, although on average the value for percent canopy cover in the field plots was slightly lower than the map value. For the pre-treatment map the average difference was –5.42% canopy cover (SE = 1.12), and for the post-treatment map the average difference was –2.05% canopy cover (SE = 1.21). The canopy cover values for the field plots and associated map polygon were within 15% of each other at least half the time for both the pre-treatment and post-treatment maps (Fig. A1).
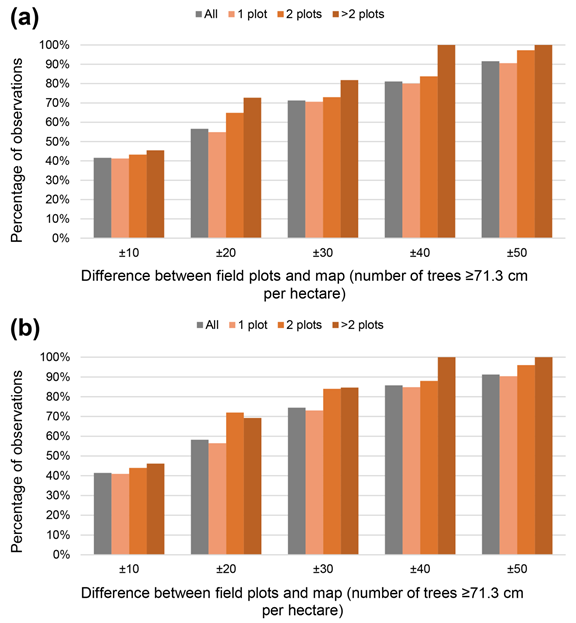
For large tree density, the field plot and map values were again similar, but the field plot values were again consistently lower than the map values. For the pre-treatment map the average difference was = –7.05 large trees per hectare (SE = 1.51), and for the post-treatment map the average difference was = –4.30 large trees per hectare (SE = 1.55). The large tree densities for the field plots and associated map polygon were within 20 trees per hectare of each other at least half the time both the pre-treatment and post-treatment maps (Fig. A2).
Fig. A1. The proportion of observations where the value for percent canopy cover within field plots and their associated map polygon were within the specified range of each other on the Last Chance Study Area, California, for (a) the pre-treatment map used in “no treatment” scenarios; and (b) the post-treatment map used in “treatment” scenarios.
Fig. A2. The proportion of observations where the number of large tree (≥71.3 cm dbh) per hectare within field plots and their associated map polygon were within the specified range of each other on the Last Chance Study Area, California, for (a) the pre-treatment map used in “no treatment” scenarios; and (b) the post-treatment map used in “treatment” scenarios.