Ecological Archives C006-100-A1
Meng Xu, Yongfan Wang, and Shixiao Yu. 2015. Conspecific negative density dependence decreases with increasing species abundance. Ecosphere 6:257. http://dx.doi.org/10.1890/es15-00144.1
Appendix A. A table of tree abundance and basal area of the five species used in manipulative experiments in the 6 ha plots, and figures showing a sketch map for experimental design in the laboratory, a sketch map for experimental design in the field, density effect in the control treatment and the sterilization treatment as a function of basal area of adult trees in the 6 ha plots, and density effects in the control treatment and the fungicide treatment as a function of basal area of adult trees in the 6 ha plots.
Table A1. Tree abundance and basal area of the five species used in manipulative experiments in the 6 ha plots.
Species |
Family |
Adult abundance |
Abundance |
Adult basal area (cm²) |
Basal area (cm²) |
Engelhardia fenzelii |
Juglandaceae |
389 |
764 |
107854.91 |
116772.65 |
Castanopsis fabri |
Fagaceae |
329 |
577 |
126893.35 |
130502.25 |
Cryptocarya concinna |
Lauraceae |
87 |
1579 |
13487.45 |
31443.28 |
Ormosia glaberrima |
Leguminosae |
19 |
141 |
3061.39 |
4835.27 |
Bridelia monoica |
Euphorbiaceae |
1 |
13 |
137.05 |
505.08 |
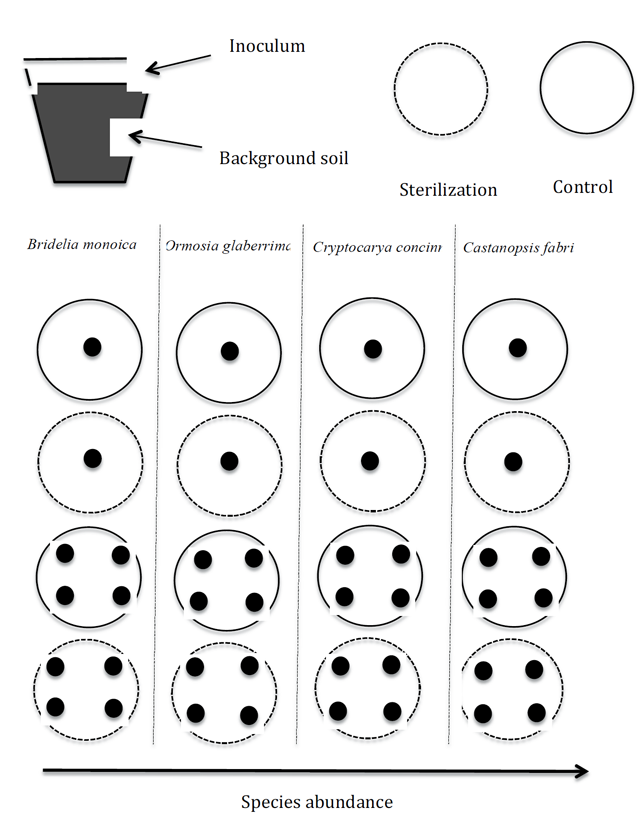
Fig. A1. Sketch map for experimental design in the laboratory.
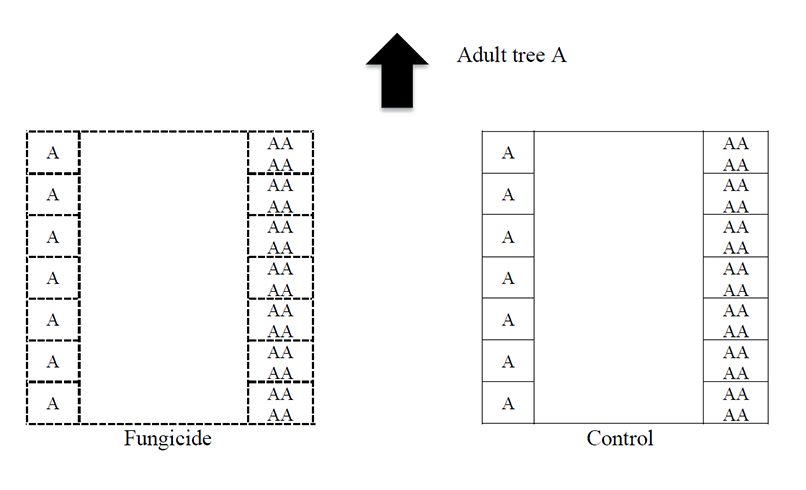
Fig. A2. Sketch map for experimental design in the field.
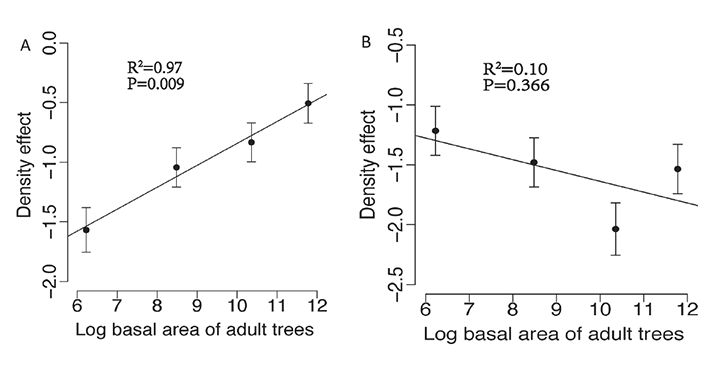
Fig. A3. Density effect in the control treatment (a) and the sterilization treatment (b) as a function of basal area of adult trees in the 6 ha plots. The density effect was expressed as the ratio of seedling survival to mortality in the high density treatment vs. the low density treatment (log odds ratio). The circles are the estimated means, and the bars indicate standard errors.
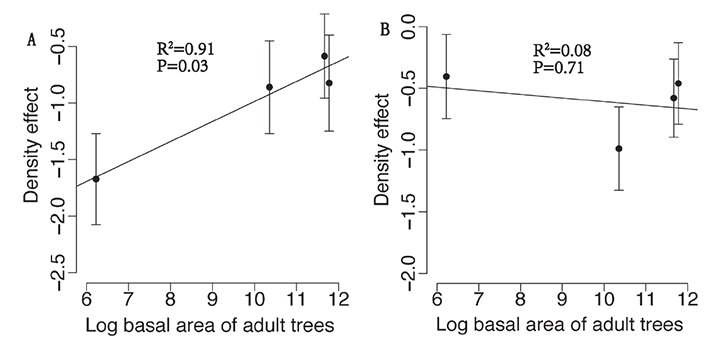
Fig. A4. Density effects in the control treatment (a) and the fungicide treatment (b) as a function of basal area of adult trees in the 6 ha plots. The density effect was expressed as the ratio of seedling survival to mortality of the high density treatment vs. the low density treatment (log odds ratio). The circles are the estimated means, and the bars indicate standard errors.