Ecological Archives C006-089-A1
A. C. Ashbacher and E. E. Cleland. 2015. Native and exotic plant species show differential growth but similar functional trait responses to experimental rainfall. Ecosphere 6:245. http://dx.doi.org/10.1890/es15-00059.1
Appendix A. Additional figures and tables comparing growth and physiological traits between herbaceous exotic, and juvenile native shrub species, and statistical output (p values) for physiological trait analysis.
Table A1. Percent survival of all planted juvenile shrubs under a given treatment from January 1, 2011 to February 10, 2012. Abbreviations are: ADFA (Adenostoma fasiculatum), ARCA (Artemesia californica), CEGR (Ceanothus gregii), ENCA (Encelia californica), MALA (Malosma laurena), RHUS (Rhus integrifolia), SAAP (Saliva apiana), SAME (Salvia melifera). Highlighted species (bold) were used in analyses.
Table A1. Juvenile shrub percent survival |
|||||||||
Date |
Treatment (% ppt) |
Juvenile Shrub Species code |
|||||||
ADFA |
ARCA |
CEGR |
ENCA |
MALA |
RHUS |
SAAP |
SAME |
||
Jan 1, 2011 |
0 |
100 |
100.0 |
100.0 |
100.0 |
100.0 |
100.0 |
100.0 |
100.0 |
50 |
100 |
100.0 |
100.0 |
100.0 |
100.0 |
100.0 |
100.0 |
100.0 |
|
100 |
100 |
100.0 |
100.0 |
100.0 |
100.0 |
100.0 |
100.0 |
100.0 |
|
100 |
100 |
100.0 |
100.0 |
100.0 |
100.0 |
100.0 |
100.0 |
100.0 |
|
150 |
100 |
100.0 |
100.0 |
100.0 |
100.0 |
100.0 |
100.0 |
100.0 |
|
200 |
100 |
100.0 |
100.0 |
100.0 |
100.0 |
100.0 |
100.0 |
100.0 |
|
Feb 7, 2011 |
0 |
33.3 |
53.3 |
20.0 |
60.0 |
33.3 |
60.0 |
40.0 |
60.0 |
50 |
33.3 |
73.3 |
46.7 |
73.3 |
60.0 |
66.7 |
66.7 |
86.7 |
|
100 |
80 |
66.7 |
26.7 |
93.8 |
73.3 |
93.3 |
86.7 |
100.0 |
|
100 |
100 |
88.9 |
88.9 |
100.0 |
88.9 |
88.9 |
100.0 |
100.0 |
|
150 |
40 |
73.3 |
66.7 |
93.3 |
80.0 |
86.7 |
66.7 |
100.0 |
|
200 |
66.7 |
86.7 |
73.3 |
80.0 |
46.7 |
73.3 |
93.3 |
93.3 |
|
Mar 15, 2011 |
0 |
33.3 |
53.3 |
13.3 |
60.0 |
20.0 |
60.0 |
40.0 |
73.3 |
50 |
33.3 |
66.7 |
33.3 |
73.3 |
53.3 |
66.7 |
66.7 |
86.7 |
|
100 |
80.0 |
66.7 |
26.7 |
93.8 |
73.3 |
80.0 |
86.7 |
93.3 |
|
100 |
100.0 |
88.9 |
55.6 |
100.0 |
88.9 |
88.9 |
100.0 |
100.0 |
|
150 |
40.0 |
73.3 |
66.7 |
93.3 |
80.0 |
86.7 |
66.7 |
86.7 |
|
200 |
66.7 |
86.7 |
66.7 |
80.0 |
46.7 |
73.3 |
93.3 |
86.7 |
|
Apr 18, 2011 |
0 |
33.3 |
53.3 |
13.3 |
60.0 |
20.0 |
60.0 |
40.0 |
73.3 |
50 |
33.3 |
66.7 |
33.3 |
66.7 |
46.7 |
66.7 |
60.0 |
86.7 |
|
100 |
80.0 |
46.7 |
26.7 |
87.5 |
66.7 |
80.0 |
80.0 |
93.3 |
|
100 |
100.0 |
88.9 |
44.4 |
88.9 |
66.7 |
77.8 |
100.0 |
100.0 |
|
150 |
40.0 |
73.3 |
66.7 |
93.3 |
66.7 |
86.7 |
66.7 |
80.0 |
|
200 |
60.0 |
80.0 |
60.0 |
80.0 |
46.7 |
73.3 |
93.3 |
86.7 |
|
May 9, 2011 |
0 |
20.0 |
53.3 |
6.7 |
53.3 |
13.3 |
46.7 |
40.0 |
66.7 |
50 |
26.7 |
66.7 |
33.3 |
66.7 |
33.3 |
60.0 |
60.0 |
86.7 |
|
100 |
80.0 |
40.0 |
13.3 |
31.3 |
33.3 |
33.3 |
66.7 |
93.3 |
|
100 |
100.0 |
77.8 |
22.2 |
66.7 |
44.4 |
55.6 |
87.5 |
90.0 |
|
150 |
40.0 |
60.0 |
53.3 |
66.7 |
60.0 |
73.3 |
60.0 |
80.0 |
|
200 |
53.3 |
46.7 |
40.0 |
40.0 |
6.7 |
40.0 |
93.3 |
86.7 |
|
Dec 7, 2011 |
0 |
0.0 |
6.7 |
6.7 |
13.3 |
0.0 |
26.7 |
13.3 |
0.0 |
50 |
6.7 |
13.3 |
0.0 |
26.7 |
13.3 |
6.7 |
20.0 |
40.0 |
|
100 |
6.7 |
6.7 |
0.0 |
0.0 |
0.0 |
0.0 |
6.7 |
6.7 |
|
100 |
6.7 |
11.1 |
11.1 |
11.1 |
11.1 |
0.0 |
11.1 |
6.7 |
|
150 |
13.3 |
20.0 |
26.7 |
26.7 |
13.3 |
13.3 |
33.3 |
33.3 |
|
200 |
6.7 |
20.0 |
6.7 |
6.7 |
6.7 |
13.3 |
13.3 |
13.3 |
|
Feb 10, 2012 |
0 |
0.0 |
0.0 |
0.0 |
11.1 |
0.0 |
13.3 |
6.6 |
0.0 |
50 |
6.7 |
0.0 |
0.0 |
20.0 |
0.0 |
6.7 |
13.3 |
26.7 |
|
100 |
6.7 |
6.7 |
0.0 |
0.0 |
0.0 |
0.0 |
6.7 |
6.7 |
|
100 |
6.7 |
11.1 |
0.0 |
11.1 |
0.0 |
0.0 |
11.1 |
6.7 |
|
150 |
6.7 |
13.3 |
0.0 |
20.0 |
0.0 |
0.0 |
33.3 |
33.3 |
|
200 |
6.7 |
20.0 |
0.0 |
6.7 |
0.0 |
0.0 |
0.0 |
13.3 |
|
Mar 5, 2012 |
0 |
0.0 |
0.0 |
0.0 |
11.1 |
0.0 |
11.1 |
16.6 |
0.0 |
50 |
6.7 |
0.0 |
0.0 |
16.6 |
0.0 |
5.5 |
6.7 |
20.0 |
|
100 |
6.7 |
6.7 |
0.0 |
0.0 |
0.0 |
0.0 |
6.7 |
6.7 |
|
100 |
6.7 |
11.1 |
0.0 |
0.0 |
0.0 |
0.0 |
6.7 |
6.7 |
|
150 |
6.7 |
6.7 |
0.0 |
20.0 |
0.0 |
0.0 |
33.3 |
33.3 |
|
200 |
6.7 |
16.6 |
0.0 |
6.7 |
0.0 |
0.0 |
0.0 |
11.1 |
|
Table A2. ANCOVA, Linear-mixed effects, and full multivariate “Adonis” p values for all measured physiological traits following a small, medium, and large rain event for adult and juvenile A. fasiculatum shrubs. We found the greatest effect under conditions of high rainfall (event 3) with juveniles having a greater response to rainfall treatments than adults. The full “Adonis” model (all rain events and traits) did not result in any significant interaction between our treatments and the two age classes.
Table A2. Physiological traits: Established adult vs. Juvenile A. Fasiculatum |
||||||||
Event size (mm²) |
Independent variable(s) |
aMax |
Cond |
Transp |
WUE |
SLA |
H20c |
Adonis |
1.788 |
Treatment |
0.003** |
0.96 |
0.15 |
0.05* |
0.50 |
0.76 |
0.200 |
Age class |
0.03* |
0.07 |
0.01** |
0.98 |
0.66 |
0.98 |
0.436 |
|
T*A |
0.26 |
0.44 |
0.03* |
0.54 |
0.41 |
0.99 |
0.708 |
|
12.45 |
Treatment |
0.35 |
0.02* |
0.17 |
0.91 |
0.04* |
0.001*** |
0.212 |
Age class |
0.28 |
0.27 |
0.67 |
0.30 |
0.001*** |
0.71 |
0.007 |
|
T*A |
0.66 |
0.64 |
0.12 |
0.65 |
0.88 |
0.35 |
0.843 |
|
18.80 |
Treatment |
0.87 |
0.04 |
0.001*** |
0.22 |
0.25 |
0.28 |
0.253 |
Age class |
0.08 |
<0.001*** |
0.001*** |
0.51 |
0.001*** |
0.43 |
0.006 |
|
T*A |
0.40 |
0.14 |
<0.001*** |
0.46 |
0.66 |
0.57 |
0.649 |
|
Total Linear mixed effects |
Treatment |
0.01** |
0.01** |
0.06 |
0.63 |
0.01** |
0.01** |
0.036* |
Age class |
0.003** |
0.03* |
0.07 |
0.54 |
<0.001*** |
0.76 |
0.81 |
|
Event |
<0.0001*** |
<0.0001*** |
<0.0001*** |
0.02* |
0.70 |
0.002** |
0.048* |
|
T*A |
0.08 |
0.36 |
0.38 |
0.58 |
0.21 |
0.30 |
0.172 |
|
T*E |
0.003** |
0.15 |
0.94 |
0.04* |
0.80 |
0.12 |
0.085 |
|
A*E |
0.12 |
0.12 |
0.76 |
0.37 |
0.09 |
0.94 |
0.278 |
|
T*A*E |
0.21 |
0.35 |
0.04* |
0.78 |
0.58 |
0.77 |
0.271 |
|
Table A3. ANCOVA, linear-mixed effects, and full multivariate “Adonis” p values for all measured physiological traits following a small, medium, and large rain event for native juvenile shrubs and exotic herbaceous species. No significant interactions were found for any individual rain event. The full Adonis model (all rain events and traits) produced a significant origin by event interaction however, high levels of variability in species level responses prevent us from using traits as a predictive measure at the origin level.
Table A3. Physiological traits: Native juvenile shrubs vs. Exotic herbaceous species |
||||||||
Event size (mm²) |
Independent variable(s) |
aMax |
Cond |
Transp |
WUE |
SLA |
H20c |
Adonis |
1.78 |
Treatment |
0.68 |
0.41 |
0.34 |
0.04* |
0.40 |
0.72 |
0.16 |
Origin |
0.01** |
0.81 |
0.68 |
0.07 |
0.002** |
0.29 |
0.001*** |
|
Species |
0.75 |
0.40 |
0.32 |
0.42 |
0.001*** |
0.02* |
0.001*** |
|
T*O |
0.64 |
0.92 |
0.40 |
0.55 |
0.60 |
0.16 |
0.65 |
|
T*S |
0.15 |
0.20 |
0.09 |
0.21 |
0.80 |
0.33 |
0.40 |
|
12.45 |
Treatment |
0.04* |
0.002** |
0.04* |
0.88 |
0.04* |
0.24 |
0.006 |
Origin |
0.12 |
0.97 |
0.51 |
0.46 |
<0.001*** |
0.55 |
0.001*** |
|
Species |
0.38 |
0.91 |
0.50 |
0.57 |
<0.001*** |
<0.001*** |
0.002** |
|
T*O |
0.87 |
0.84 |
0.66 |
0.88 |
0.27 |
0.04* |
0.68 |
|
T*S |
0.60 |
0.84 |
0.54 |
0.80 |
0.35 |
0.55 |
0.87 |
|
18.80 |
Treatment |
0.73 |
0.08 |
0.001*** |
0.006 |
0.19 |
0.91 |
0.04* |
Origin |
0.05* |
0.58 |
0.76 |
0.14 |
<0.001*** |
0.08 |
0.001*** |
|
Species |
<0.001*** |
0.02* |
0.004** |
0.38 |
<0.001*** |
<0.001*** |
0.001*** |
|
T*O |
0.99 |
0.56 |
0.89 |
0.92 |
0.96 |
0.39 |
0.98 |
|
T*S |
0.64 |
0.82 |
0.19 |
0.75 |
0.97 |
0.99 |
0.88 |
|
Total Linear mixed effects |
Treatment |
0.12 |
0.008** |
0.008** |
0.02* |
0.28 |
0.74 |
0.001*** |
Origin |
<0.0001*** |
0.12 |
0.21 |
0.13 |
<0.0001*** |
0.99 |
0.456 |
|
Species |
… |
… |
… |
… |
… |
… |
0.04* |
|
T*O |
0.77 |
0.83 |
0.94 |
0.59 |
0.38 |
0.96 |
0.623 |
|
T*S |
… |
… |
… |
… |
… |
… |
0.785 |
|
T*E |
0.23 |
0.03* |
0.41 |
0.05* |
0.98 |
0.93 |
0.190 |
|
O*E |
0.10 |
0.88 |
0.58 |
0.83 |
0.54 |
0.18 |
0.518 |
|
S*E |
… |
… |
… |
… |
… |
… |
0.515 |
|
T*O*E |
0.60 |
0.81 |
0.57 |
0.84 |
0.49 |
0.05 |
0.984 |
|
T*S*E |
… |
… |
... |
… |
… |
… |
0.681 |
|
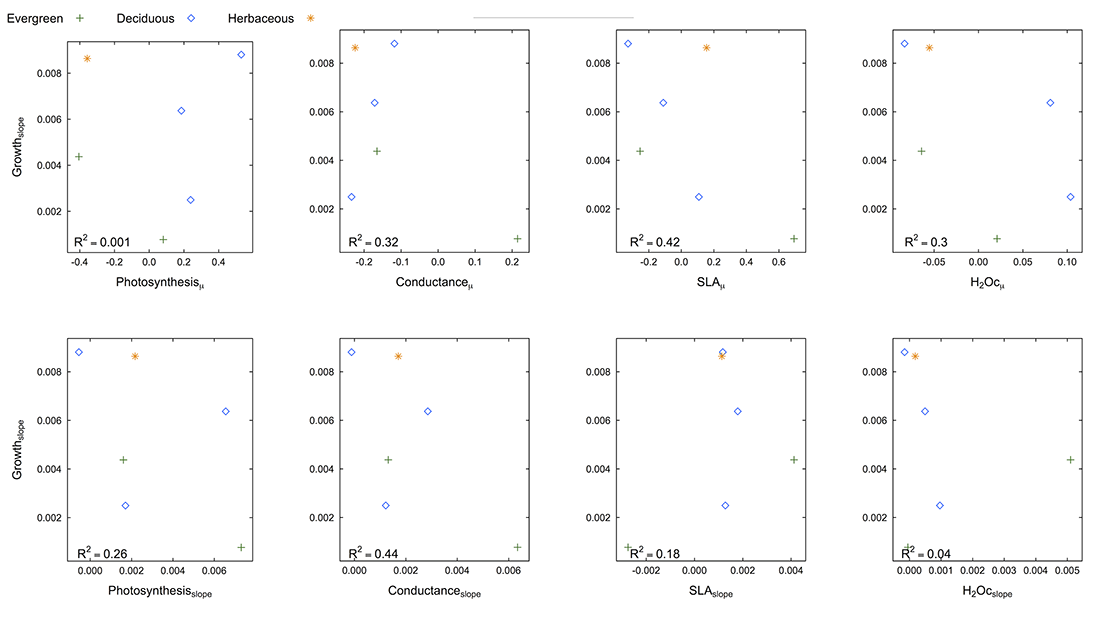
Fig. A1. Neither species’ mean trait values, nor species trait plasticity (defined as the slope of the trait response to altered rainfall) are predictive of how a species growth responds to rainfall (defined as the slope of the growth response to altered rainfall).
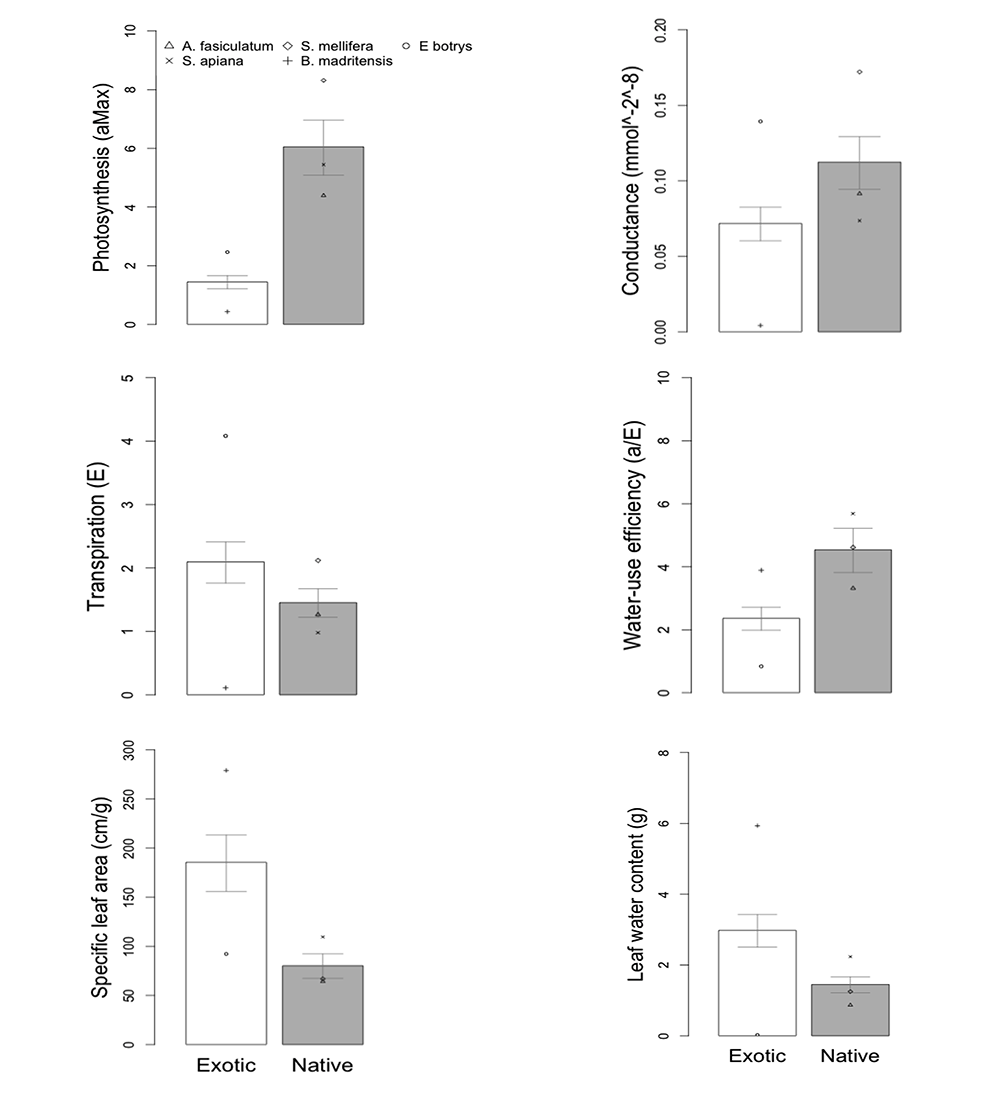
Fig. A2. Physiological trait means under ambient conditions for exotic herbaceous and native juvenile shrubs. Note the high level of variability among species within native and exotic categories.