Ecological Archives C006-083-A1
C. M. Harris, D. Sadykova, S. L. DeRuiter, P. L. Tyack, P. J. O. Miller, P. H. Kvadsheim, F. P. A. Lam, and L. Thomas. 2015. Dose response severity functions for acoustic disturbance in cetaceans using recurrent event survival analysis. Ecosphere 6:236. http://dx.doi.org/10.1890/es15-00242.1
Appendix A. Figures that are replicates of Figs. 3 and 4 in the main paper, but present the dose-response functions for severity level 1 (Figs. A1 and A3) and severity level 3 (Figs. A2 and A4).
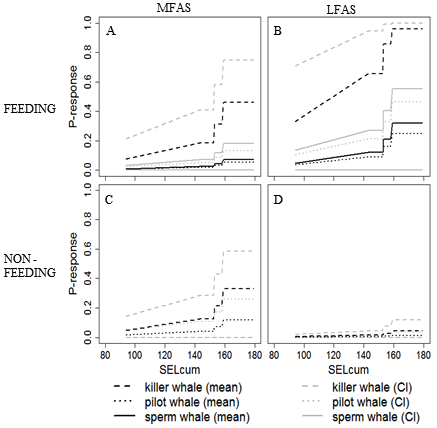
Fig. A1. The probability of a response occurring in killer whales (dashed line), long-finned pilot whales (dotted line) and sperm whales (solid line) vs. received acoustic energy (SELcum (dB re 1 μPa²s)) for severity level = 1 when signal = MFAS (A and C) and LFAS (B and D) and behavioral state = feeding (A and B) and non-feeding (C and D). Mean probabilities are all shown in black, while 95% confidence intervals are shown in gray.
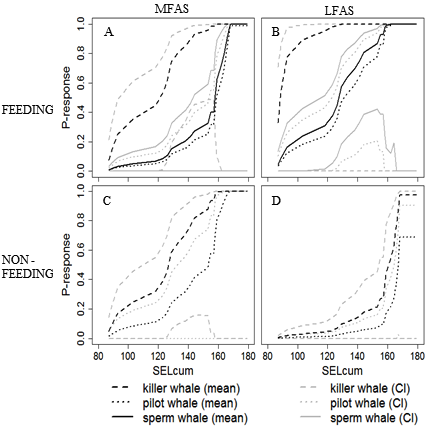
Fig. A2. The probability of a response occurring in killer whales (dashed line), long-finned pilot whales (dotted line) and sperm whales (solid line) vs. received acoustic energy (SELcum (dB re 1 μPa²s)) for severity level = 3 when signal = MFAS (A and C) and LFAS (B and D) and behavioral state = feeding (A and B) and non-feeding (C and D). Mean probabilities are all shown in black, while 95% confidence intervals are shown in gray.
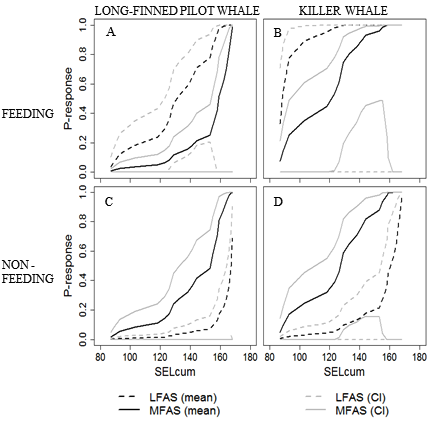
Fig. A3. The probability of a response occurring during LFAS (dashed line) and MFAS (solid line) exposures vs. received acoustic energy (SELcum (dB re 1 μPa²s)) for severity level = 1 for long-finned pilot whales (A and C) and killer whales (B and D) and when behavioral state = feeding (A and B) and non-feeding (C and D). Mean probabilities are all shown in black, while 95% confidence intervals are shown in gray.
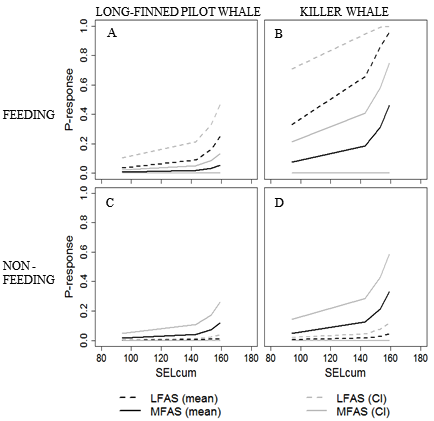
Fig. A4. The probability of a response occurring during LFAS (dashed line) and MFAS (solid line) exposures vs. received acoustic energy (SELcum (dB re 1 μPa²s)) for severity level = 3 for long-finned pilot whales (A and C) and killer whales (B and D) and when behavioral state = feeding (A and B) and non-feeding (C and D). Mean probabilities are all shown in black, while 95% confidence intervals are shown in gray.