Ecological Archives C006-081-A1
Jingfeng Xiao, Yu Zhou, and Li Zhang. 2015. Contributions of natural and human factors to increases in vegetation productivity in China. Ecosphere 6:233. http://dx.doi.org/10.1890/es14-00394.1
Appendix A. Trends in agricultural and forestry statistics and relationships of annual NDVI with crop yield and total plantation area.
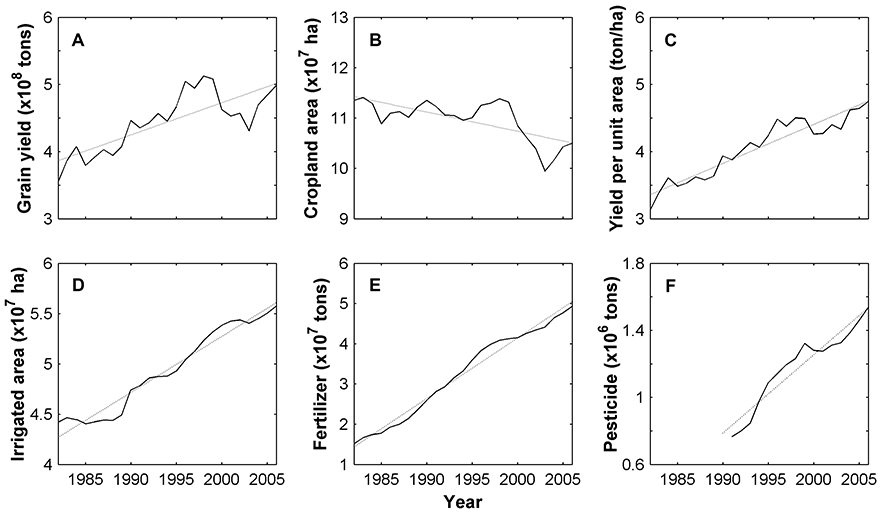
Fig. A1. Crop yield, cropland area, and agricultural management practices of China from 1982 to 2006: (A) crop yield (y = 0.048x-91.15, R² = 0.64, p < 0.0001), (B) cropland area (y = -0.038x+87.42, R² = 0.48, p < 0.001), (C) yield per unit area (y = 0.058x-112.0, R² = 0.90, p < 0.0001), (D) irrigated area (y = 0.056-106.30, R² = 0.96, p < 0.0001), (E) chemical fertilizers used (y = 0.15x-296.6, R² = 0.98, p < 0.0001), and (F) pesticide used (y = 0.047x-92,34, R² = 0.92, p < 0.0001).
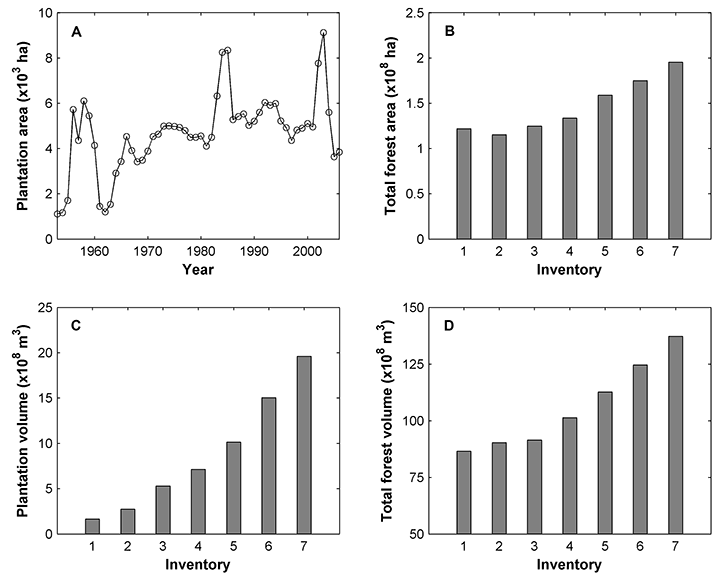
Fig. A2. Forest plantation area, total forest area, plantation volume, and total forest volume in China: (A) annual plantation area from 1953 to 2006; (B) total forest area for the seven national forest inventories; (C) plantation volume for the seven inventories; and (D) total forest volume for the seven inventories. The seven national forest inventories were conducted in 1973–1976, 1977–1981, 1984–1988, 1989–1993, 1994–1998, 1999–2003, and 2004–2008, respectively.
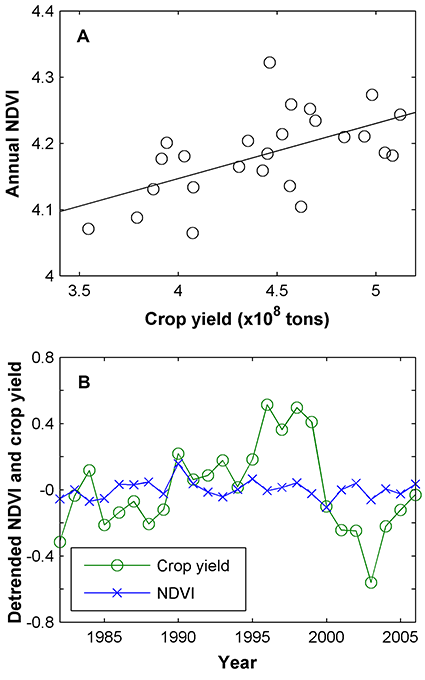
Fig. A3. Relationship between annual NDVI and crop yield in China over the period 1982–2006: (A) annual NDVI vs. crop yield prior to detrending and (B) detrended NDVI and crop yield.
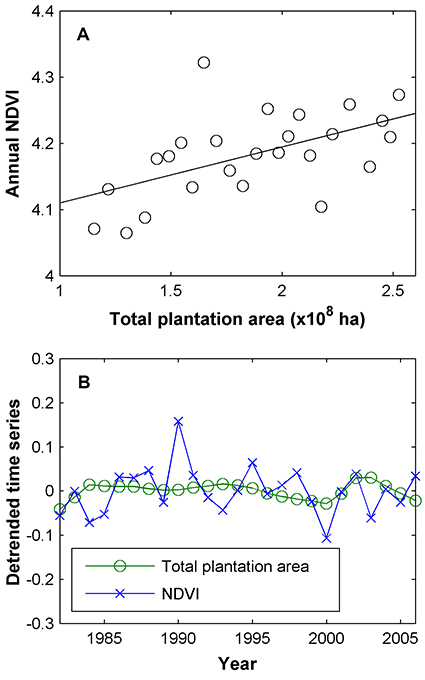
Fig. A4. Relationship between annual NDVI and total plantation area in China over the period 1982–2006: (A) NDVI vs. total plantation area prior to detrending and (B) detrended NDVI and total plantation area.