Ecological Archives C006-076-A1
Pia Anderwald, Ivar Herfindal, Rudolf M. Haller, Anita C. Risch, Martin Schütz, Anna K. Schweiger, and Flurin Filli. 2015. Influence of migratory ungulate management on competitive interactions with resident species in a protected area. Ecosphere 6:228. http://dx.doi.org/10.1890/es15-00365.1
Appendix A. A table showing parameter estimates of the relationship between abundance of red deer, chamois, and ibex, and habitat use of chamois and ibex during summer and winter in Val Trupchun, Swiss National Park, and a figure showing seasonal diet composition of chamois, ibex, and red deer by plant species.
Table A1. Parameter estimates (95% credible interval) of the relationship between abundance of red deer (NRed deer), chamois (NChamois) and ibex (NIbex) and habitat use of chamois (βChamois) and ibex (βIbex) during summer and winter in Val Trupchun, Swiss National Park. Estimates are based on the highest ranked models in Tables 2 and 3. Credible intervals are based on 10000 MCMC resamplings from the posterior distribution of the parameter estimates. Estimates for forest, meadow, rock, and scree are at the logit scale. Bold font indicates that the 95% credible interval does not overlap with zero.
Axis / Variable |
NRed deer |
|||
βChamois.Summer |
βChamois.Winter |
βIbex.Summer |
βIbex.Winter |
|
Axis 1 |
-0.0014 (-0.0021; -0.0006) |
-0.0014 (-0.0021; -0.0006) |
0.00004 (-0.00077; 0.00086) |
0.00004 (-0.00077; 0.00086) |
Axis 2 |
0.00017 (-0.0010; 0.0013) |
-0.0020 (-0.0034; -0.0005) |
0.0015 (0.0001; 0.0029) |
-0.0006 (-0.0020; 0.0007) |
Axis 3 |
-0.0009 (-0.0015; -0.0001) |
-0.0009 (-0.0015; -0.0001) |
-0.0009 (-0.0015; -0.0001) |
-0.0009 (-0.0015; -0.0001) |
Altitude (pr 100 m) |
0.0008 (-0.0051; 0.0066) |
0.0008 (-0.0051; 0.0066) |
-0.0059 (-0.0121; 0.0002) |
-0.0059 (-0.0121; 0.0002) |
Radiation |
- |
- |
- |
- |
Forest |
-2.170 (-3.569; -0.763) |
-0.687 (-1.418; 0.048) |
1.777 (0.965; 2.580) |
-0.381 (-1.575; 0.805) |
Meadow |
-0.105 (-0.305; 0.094) |
-0.363 (-0.590; -0.142) |
-0.105 (-0.305; 0.094) |
-0.363 (-0.590; -0.142) |
Rock |
- |
- |
- |
- |
Scree |
0.298 (0.079; 0.513) |
0.343 (0.042; 0.636) |
-0.240 (-0.517; 0.041) |
0.303 (0.076; 0.527) |
|
NChamois |
|||
|
βChamois.Summer |
βChamois.Winter |
βIbex.Summer |
βIbex.Winter |
Axis 1 |
0.0006 (-0.0014; 0.0026) |
-0.0017 (-0.0040; 0.0005) |
-0.0084 (-0.0108; -0.0058) |
0.0005 (-0.0013; -0.0024) |
Axis 2 |
0.0020 (-0.0005; 0.0043) |
-0.0009 (-0.0031; 0.0012) |
0.0020 (-0.0003; 0.0043) |
-0.0009 (-0.0031; 0.0012) |
Axis 3 |
-0.0003 (-0.0020; 0.0015) |
-0.0003 (-0.0020; 0.0015) |
0.0016 (-0.0002; 0.0033) |
0.0016 (-0.0002; 0.0033) |
Altitude (pr 100 m) |
-0.0063 (-0.0210; 0.0084) |
0.0138 (-0.0026; 0.0304) |
0.0315 (0.0119; 0.0505) |
0.0048 (-0.0089; 0.0188) |
Radiation |
-2.475 (-4.806; -0.151) |
1.210 (-1.594; 4.003) |
5.742 (2.555; 8.949) |
-1.153 (-3.357; 1.057) |
Forest |
2.053 (0.523; 3.568) |
0.633 (-0.350; 1.603) |
3.421 (1.536; 5.400) |
2.001 (0.482; 3.519) |
Meadow |
0.060 (-0.410; 0.539) |
0.148 (-0.374; 0.686) |
0.443 (-0.172; 1.074) |
-0.447 (-0.875; -0.001) |
Rock |
0.619 (-0.243; 1.496) |
0.619 (-0.243; 1.496) |
1.373 (0.654; 2.102) |
1.373 (0.654; 2.102) |
Scree |
-0.240 (-0.528; 0.039) |
-0.240 (-0.528; 0.039) |
-0.240 (-0.528; 0.039) |
-0.240 (-0.528; 0.039) |
|
NIbex |
|||
|
βChamois.Summer |
βChamois.Winter |
βIbex.Summer |
βIbex.Winter |
Axis 1 |
0.0014 (-0.0001; 0.0029) |
-0.0013 (-0.0028; 0.0003) |
0.0014 (-0.0001; 0.0029) |
-0.0013 (-0.0028; 0.0003) |
Axis 2 |
0.0007 (-0.0010; 0.0024) |
-0.0014 (-0.0034; 0.0006) |
0.0048 (0.0030; 0.0067) |
-0.0001 (-0.0019; 0.0016) |
Axis 3 |
-0.0008 (-0.0017; 0.0002) |
-0.0008 (-0.0017; 0.0002) |
-0.0008 (-0.0017; 0.0002) |
-0.0008 (-0.0017; 0.0002) |
Altitude (pr 100 m) |
-0.0174 (-0.0301; -0.0049) |
0.0104 (-0.0029; 0.0239) |
-0.0351 (-0.0480; -0.0219) |
0.0036 (-0.0089; 0.0159) |
Radiation |
- |
- |
- |
- |
Forest |
-0.536 (-1.413; 0.344) |
-0.301 (-0.995; 0.407) |
2.339 (1.041; 3.638) |
-0.625 (-1.714; 0.483) |
Meadow |
0.158 (-0.118; 0.434) |
-0.271 (-0.567; 0.029) |
0.631 (0.342; 0.917) |
0.202 (-0.066; 0.474) |
Rock |
- |
- |
- |
- |
Scree |
-0.141 (-0.378; 0.097) |
0.198 (-0.084; 0.475) |
-0.622 (-0.872; -0.367) |
-0.283 (-0.505; -0.051) |
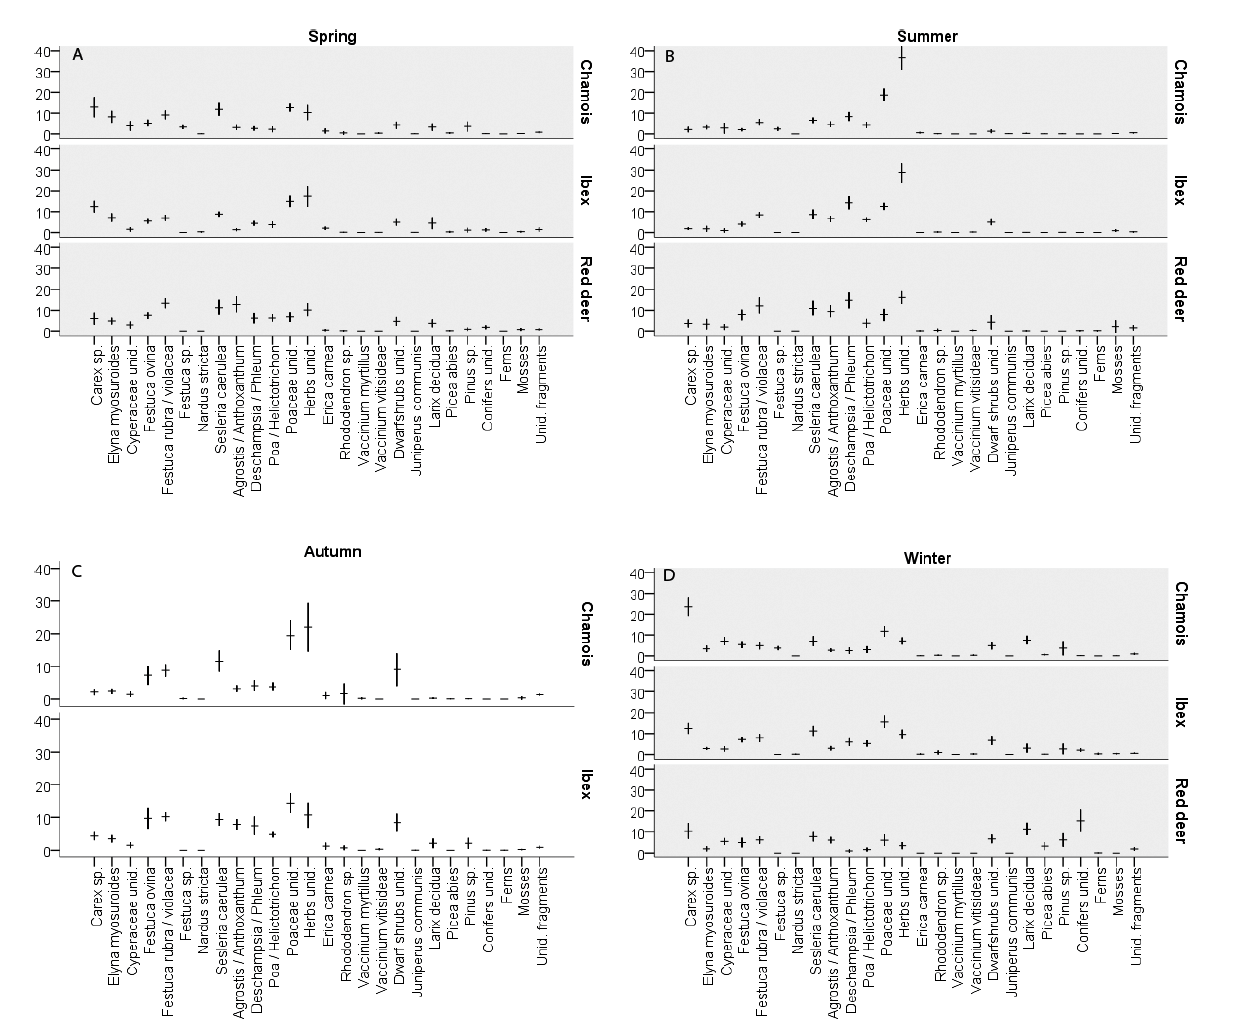
Fig. A1. Seasonal diet composition of chamois, ibex, and red deer by plant species. The y-axis represents the number of identified fragments per 100 fragments of each sample.