Ecological Archives C006-072-A1
M. Alex Smith. 2015. Ants, elevation, phylogenetic diversity and community structure. Ecosphere 6:221. http://dx.doi.org/10.1890/es14-00473.1
Appendix A. Appendix contains specific details for each study site on morphological and phylogenetic measures of alpha and beta diversity.
Table A1. Comparing the strength of measures of beta diversity and elevation using Mantel tests. Typically (15/18) the relationship is stronger when calculated with Jaccard than with phylobetadiversity. The number of significant relationships is slightly higher for phylobetadiversity than for Jaccard (9:7).
|
|
Phylobeta |
Jaccard |
||
Country |
Source |
r |
p |
r |
p |
Costa Rica, Pacific |
Smith et al 2014 |
0.657 |
0.020* |
-0.562 |
0.042* |
USA, Arizona |
Andersen 1997 |
0.264 |
0.142 |
-0.271 |
0.899 |
Austria |
Glaser 2006 |
0.627 |
0.002* |
-0.870 |
0.001* |
Brazil |
Márcia Araújo and Wilson Fernandes 2003 |
0.460 |
0.021* |
0.570 |
0.998 |
USA, Colorado |
Gregg 1963 |
-0.215 |
0.021* |
0.317 |
0.010* |
Colombia |
van der Hammen and Ward 2005 |
0.234 |
0.047* |
-0.636 |
0.001* |
Costa Rica, Atlantic |
Longino and Colwell 2011 |
0.922 |
0.003* |
-0.879 |
1.000 |
Egypt |
Orabi et al. 201 |
0.564 |
0.094 |
-0.888 |
1.000 |
USA, Georgia |
Ipser et al. 2004 |
0.400 |
0.036* |
-0.447 |
0.983 |
Guyana |
LaPolla et al 2007 |
0.110 |
0.318 |
-0.199 |
0.744 |
Madagascar |
Fisher 1998 |
0.358 |
0.091 |
-0.558 |
0.090 |
Malaysia |
Brühl et al. 1999 |
0.185 |
0.209 |
-0.607 |
1.000 |
Mongolia |
Pfeiffer et al. 2003 |
0.169 |
0.188 |
0.144 |
0.197 |
Norway |
Hågvar 2005 |
0.138 |
0.253 |
-0.543 |
0.001* |
Philippines |
Samson et al. 1997 |
0.220 |
0.242 |
-0.395 |
0.850 |
USA, Tennessee |
Lessard et al. 2007 |
0.670 |
0.001* |
-0.707 |
0.001* |
USA, New England |
Del Toro 2013 |
0.494 |
0.010* |
-0.542 |
0.005* |
India |
Sabu et al. 2008 |
0.662 |
0.198 |
-0.665 |
0.850 |
Note: Full literature citations appear in Fig. A2.
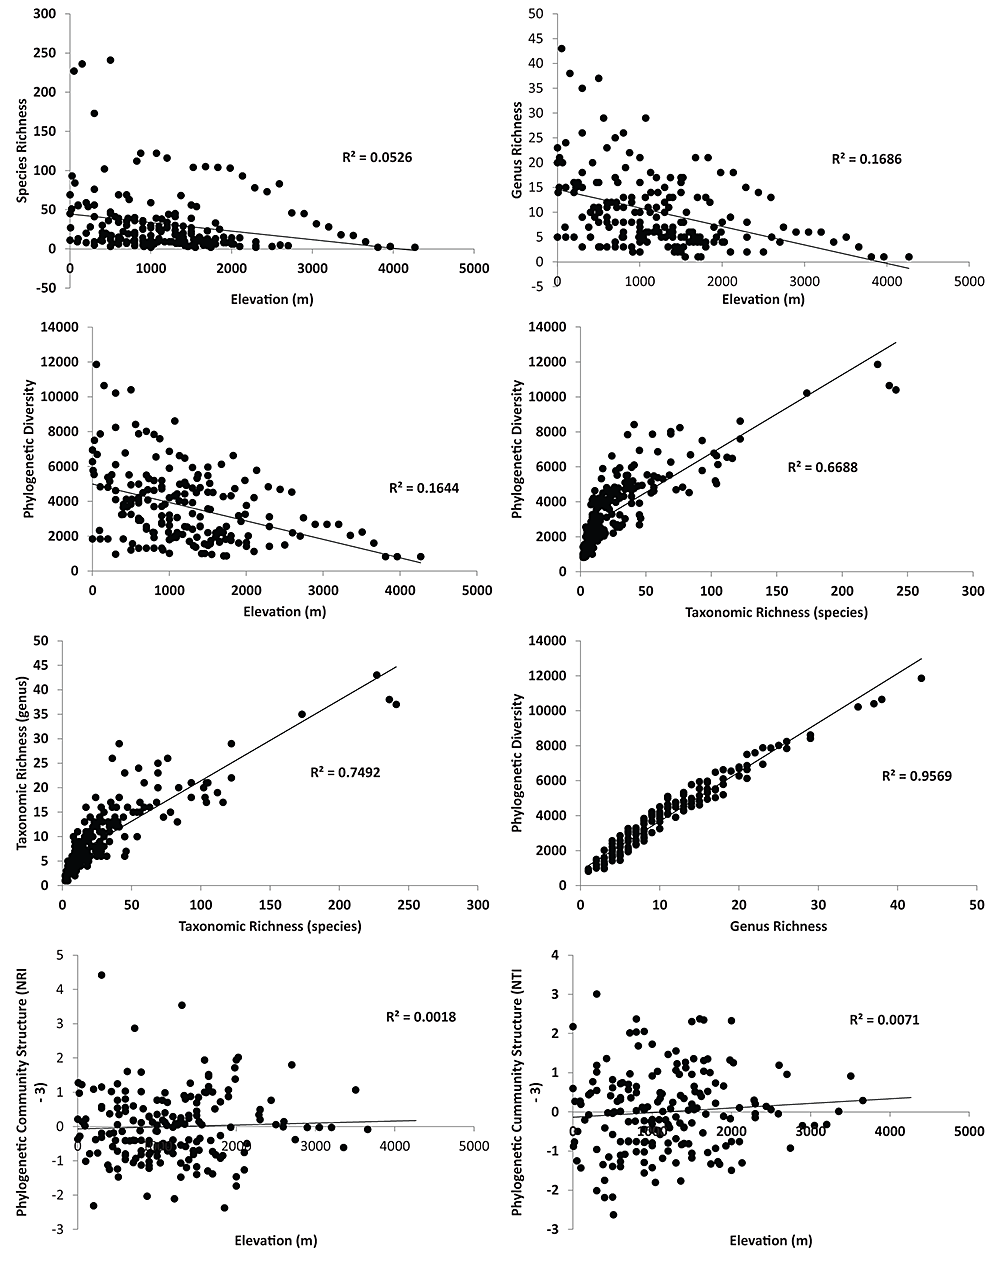
Fig. A1. Patterns of richness and community structure with elevation for the ants across the world. A – taxonomic diversity (species richness) and elevation. B – taxonomic diversity (genus richness) and elevation. C – Phylogenetic diversity and elevation. D – Phylogenetic diversity and Taxonomic diversity (species richness). E – taxonomic diversity (species richness) and taxonomic diversity (genus richness). F – Phylogenetic Diversity and Taxonomic Diversity (genus richness). G – Phylogenetic Community Structure (NRI) and elevation. H – Phylogenetic community structure (NTI) and elevation.
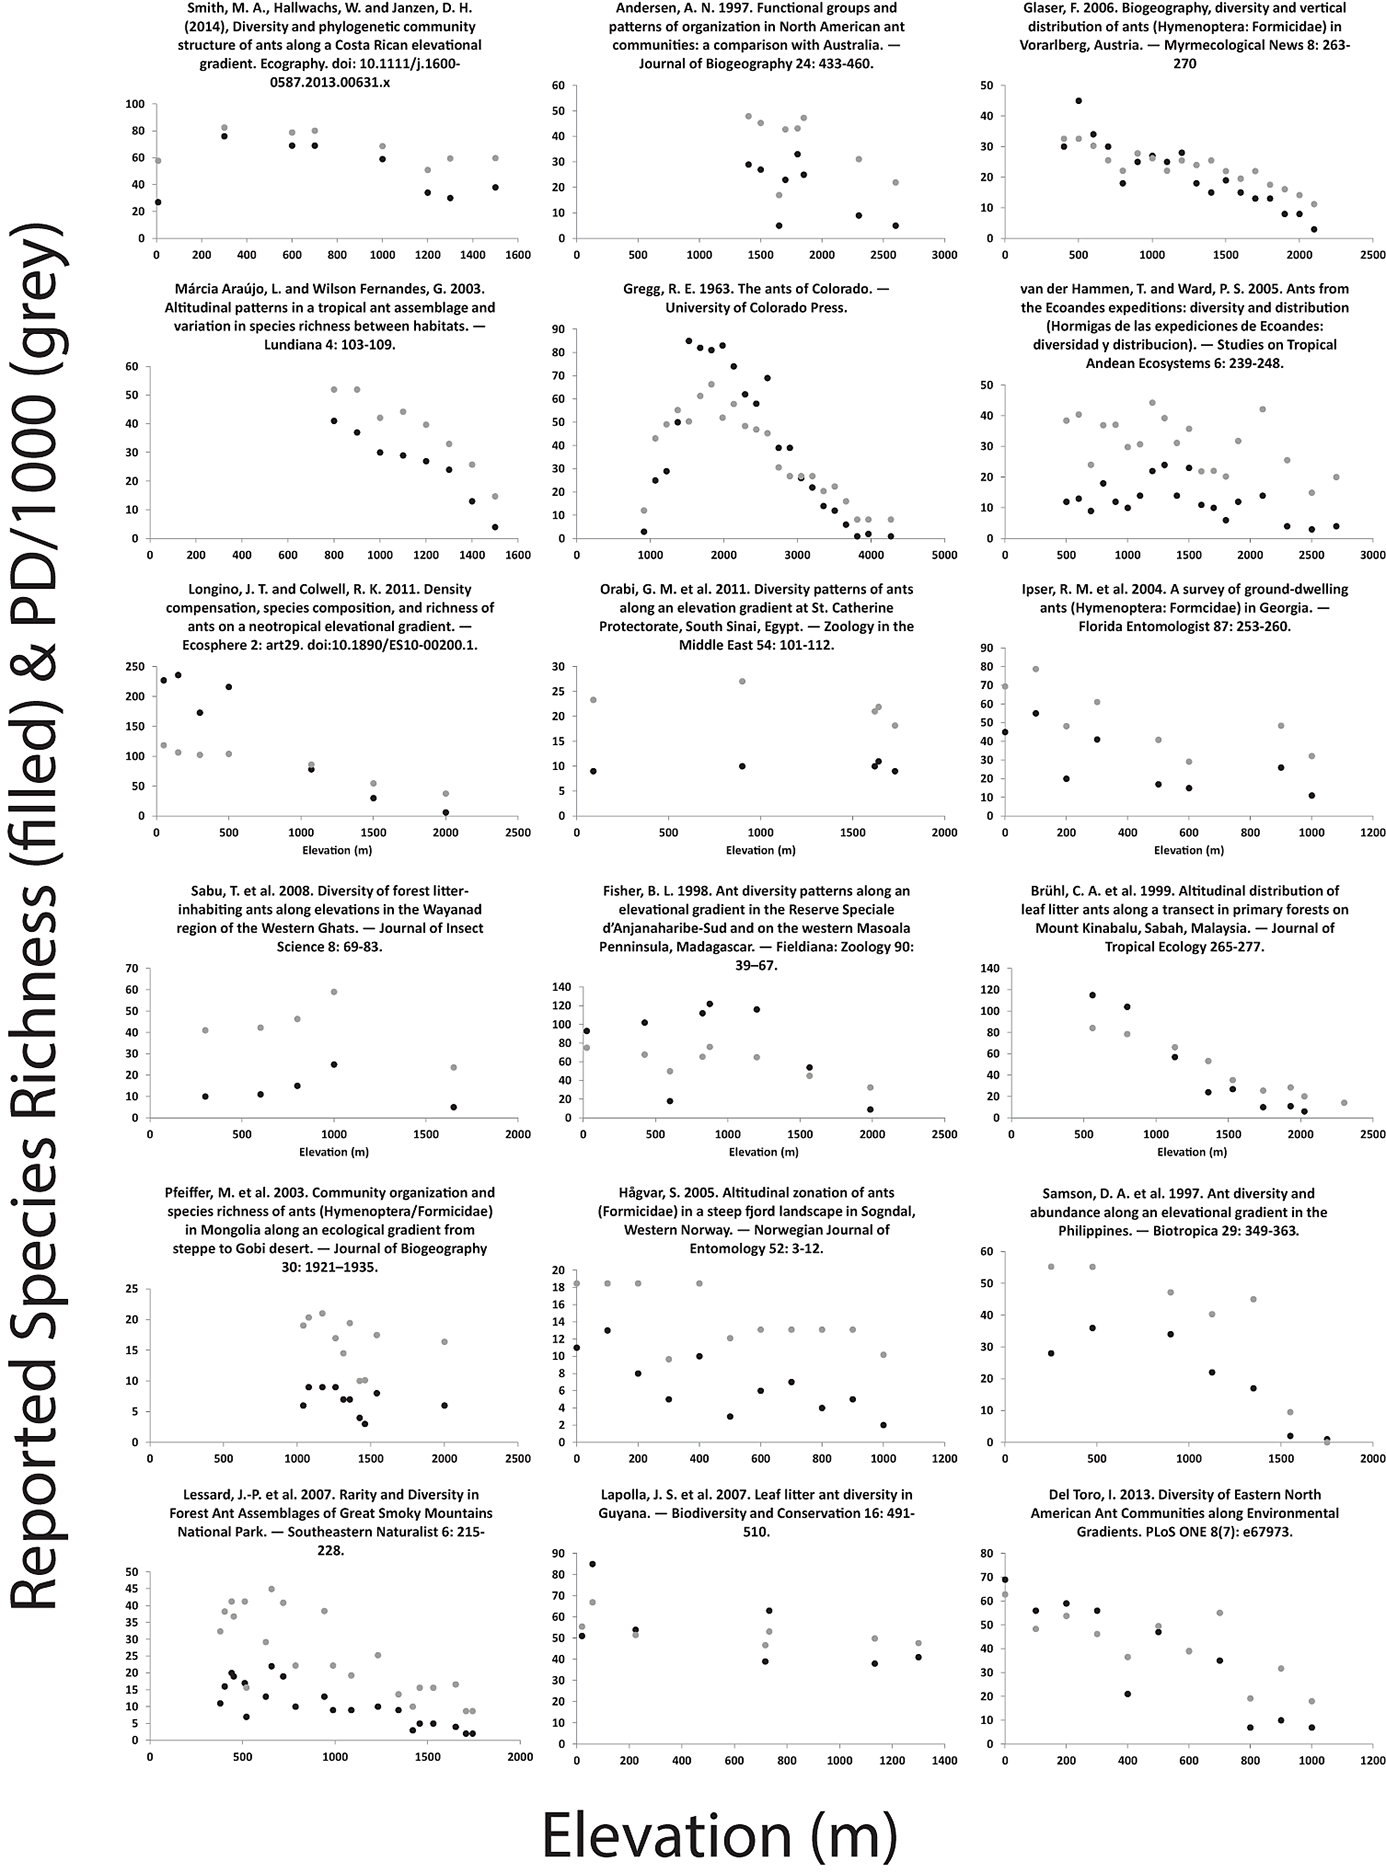
Fig. A2. Patterns of alpha diversity and elevational difference for 18 studies. Diversity was measured as the species richness reported in the study shown in black, or using a measure of phylogenetic diversity based on the observed incidence matrix from that study and the phylogeny of Moreau et al. (2006) (shown in gray).
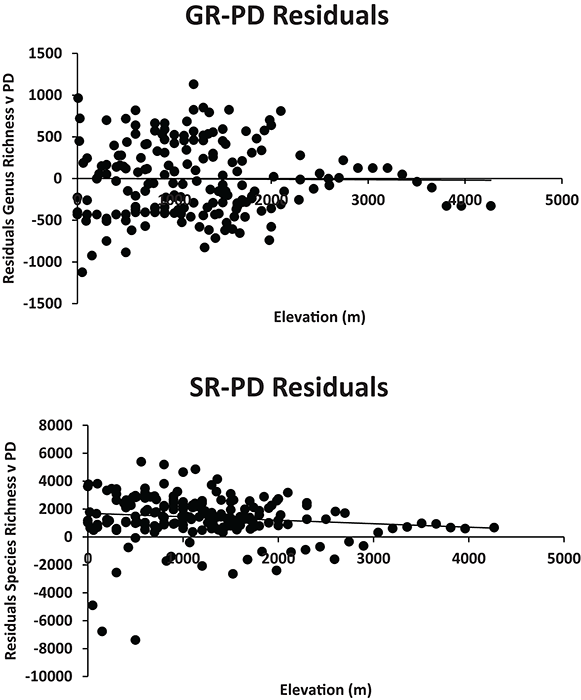
Fig. A3. The residuals of species richness and PD across elevation displayed no relationship when examined across all sites (Supplemental Data 1). Interestingly however, all the highest elevation sites had higher PD than expected based on species richness (positive residuals). Furthermore, the same was true for 17 of 18 of the lowest elevation sites. This suggests that, even though high elevation locations have lower diversity (Fig. 3), these sites likely contain greater evolutionary history than is predicted by their species-level diversity alone.
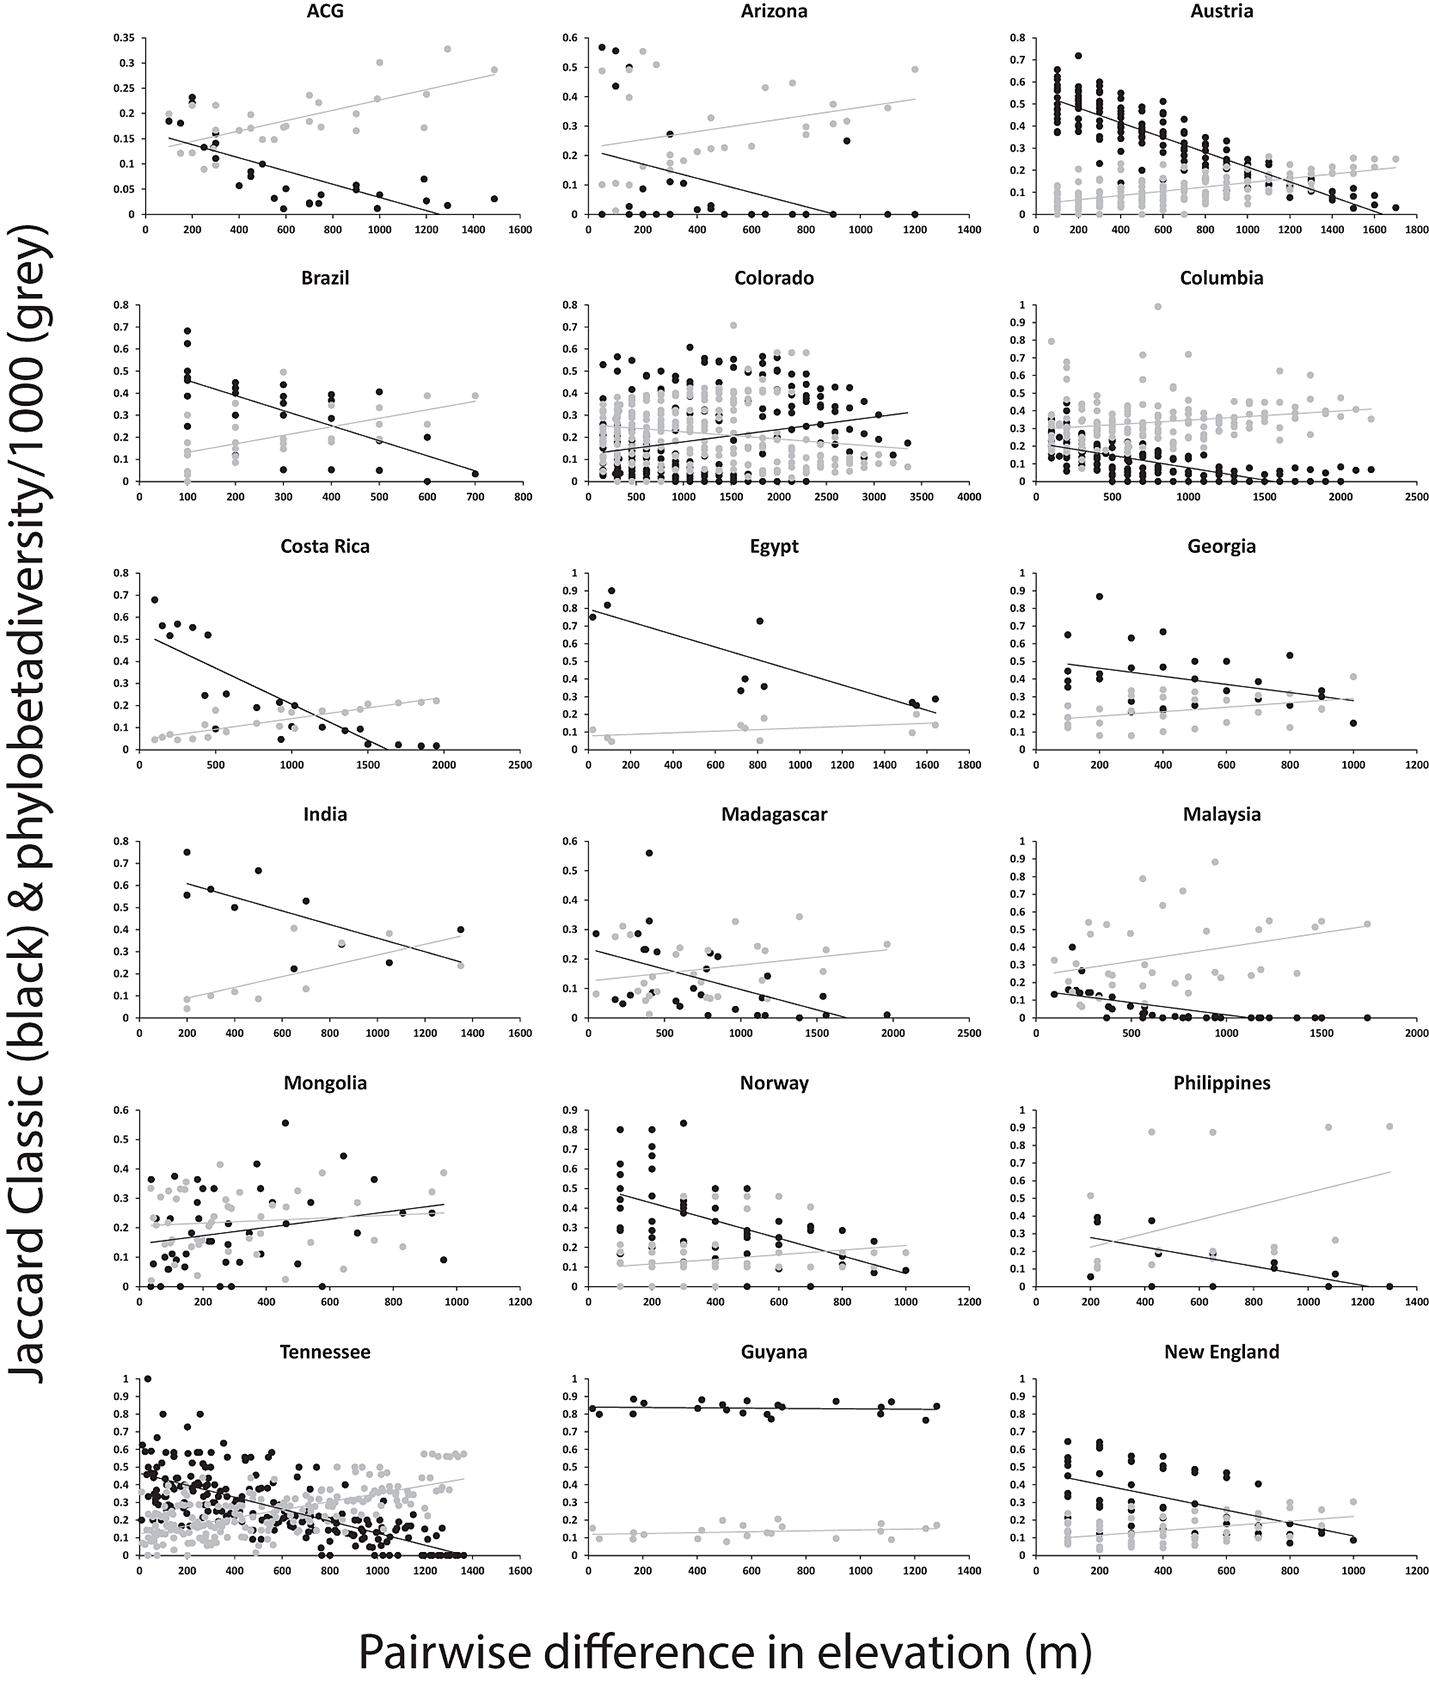
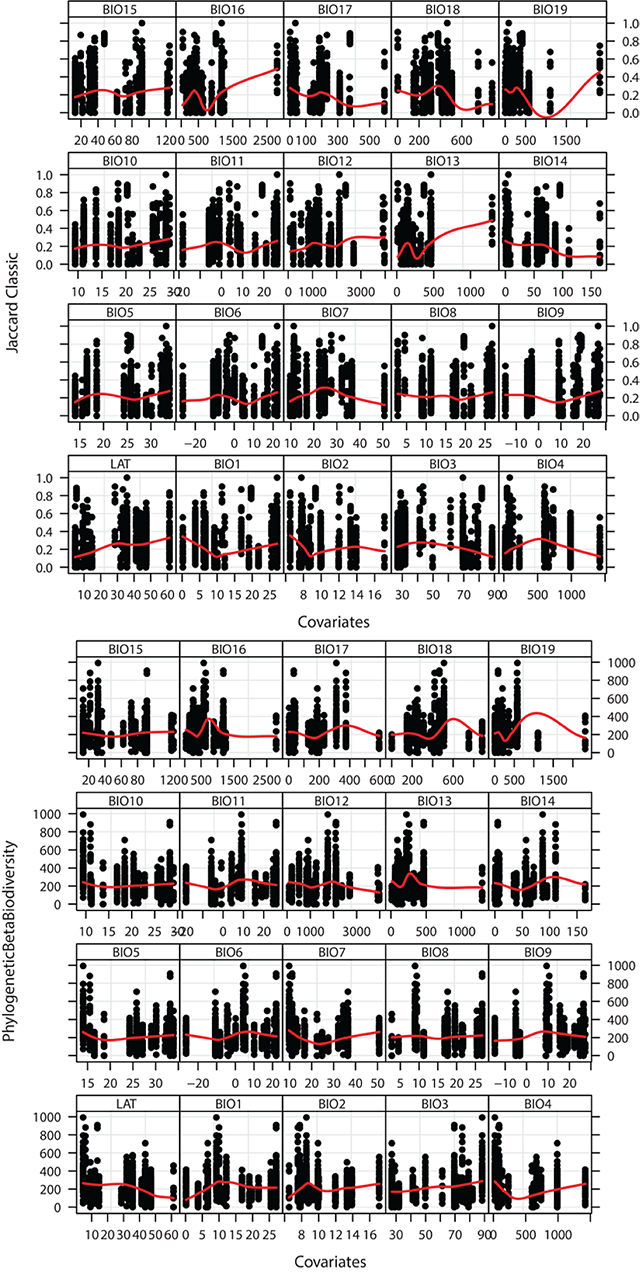
Fig. A4. Patterns of beta diversity and elevational difference for 18 studies. Complementarity was measured using the classic Jaccard Index for the taxonomic grade reported in the study shown in black, or using a measure of phylobetadiversity (the phylogenetic distance between samples, based on phylogenetic distances of taxa in one sample to the taxa in the other uses the nearest taxon method) based on the observed incidence matrix from that study and the phylogeny of Moreau et al. (2006) (shown in gray).
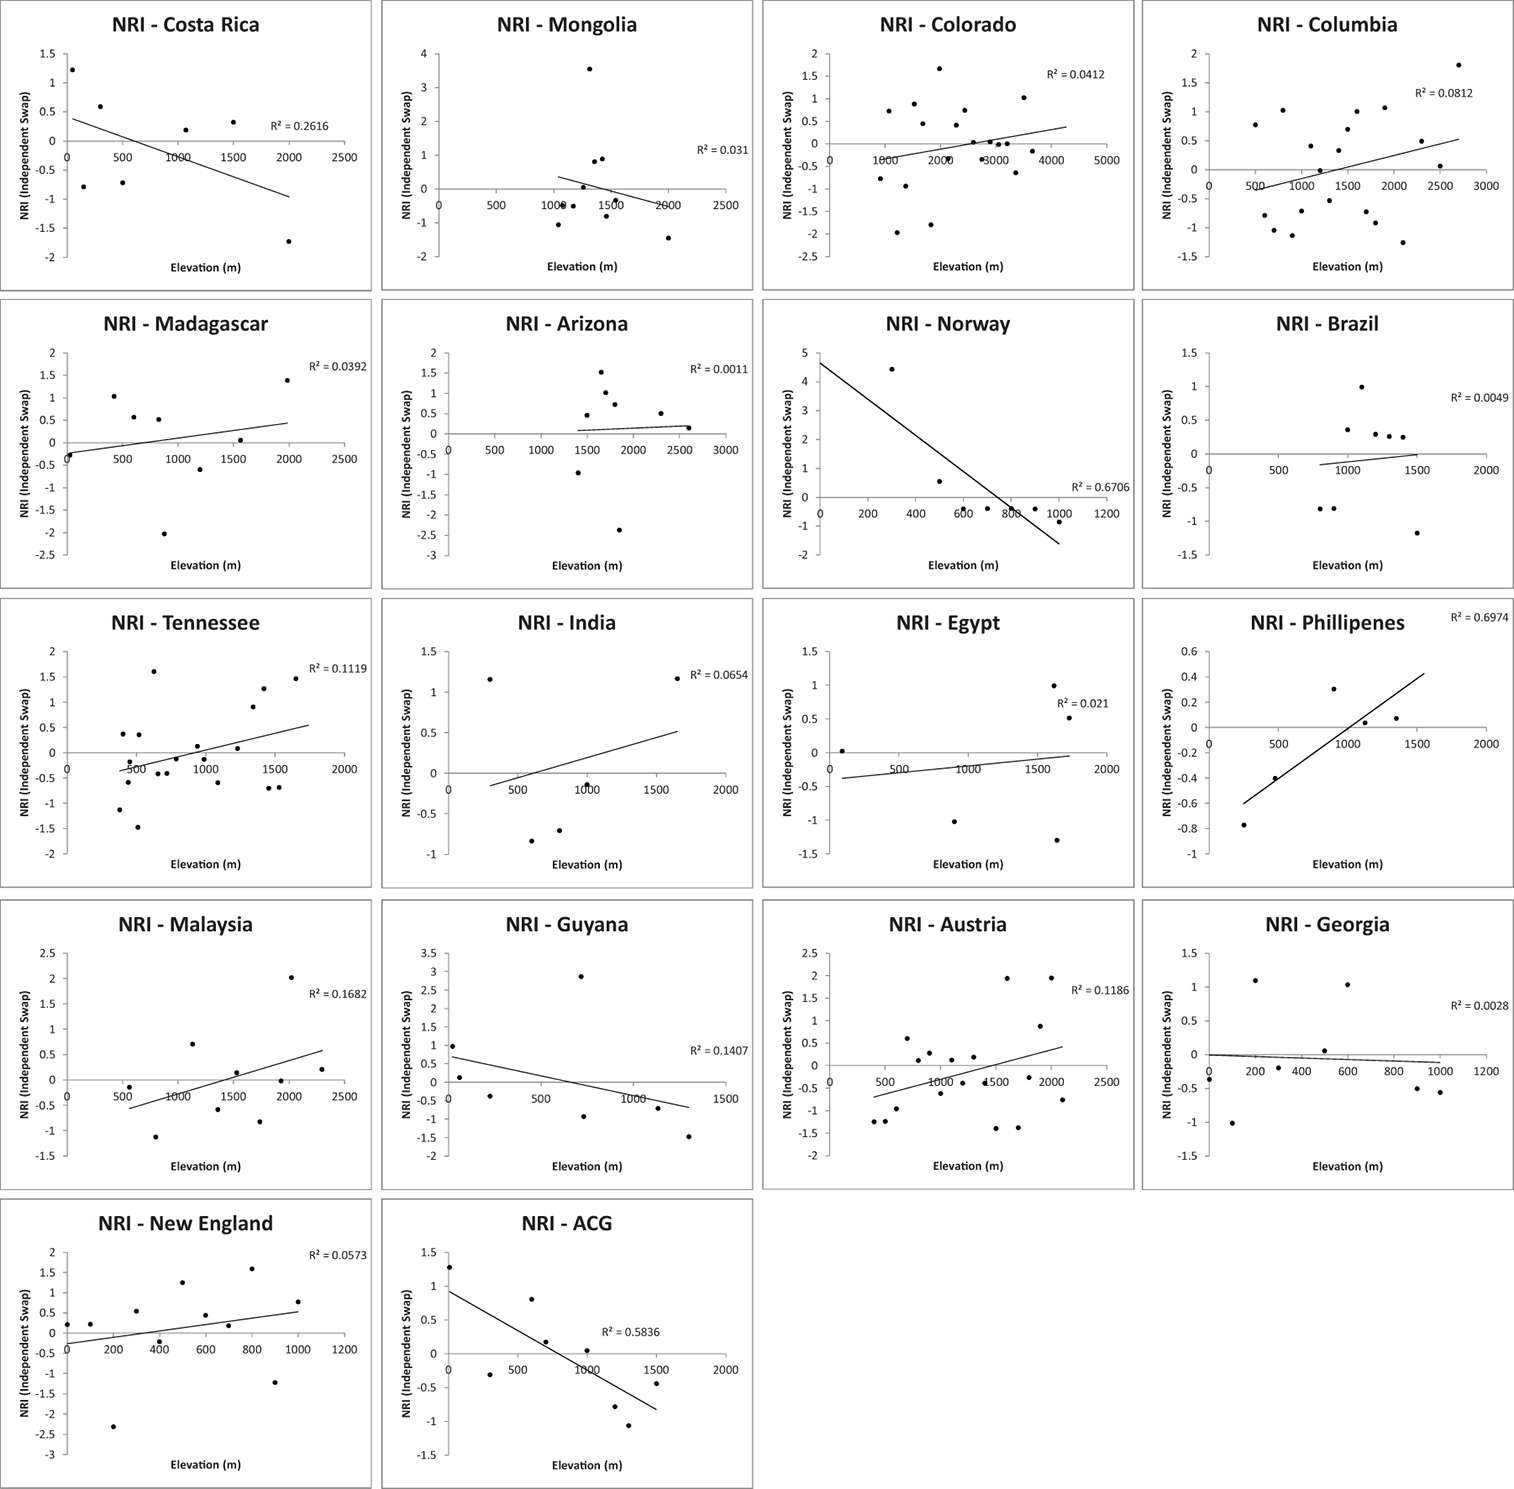
Fig. A5A. The relationship between elevation and phylogenetic community structure: phylogenetic commutity structure as measured as NRI.
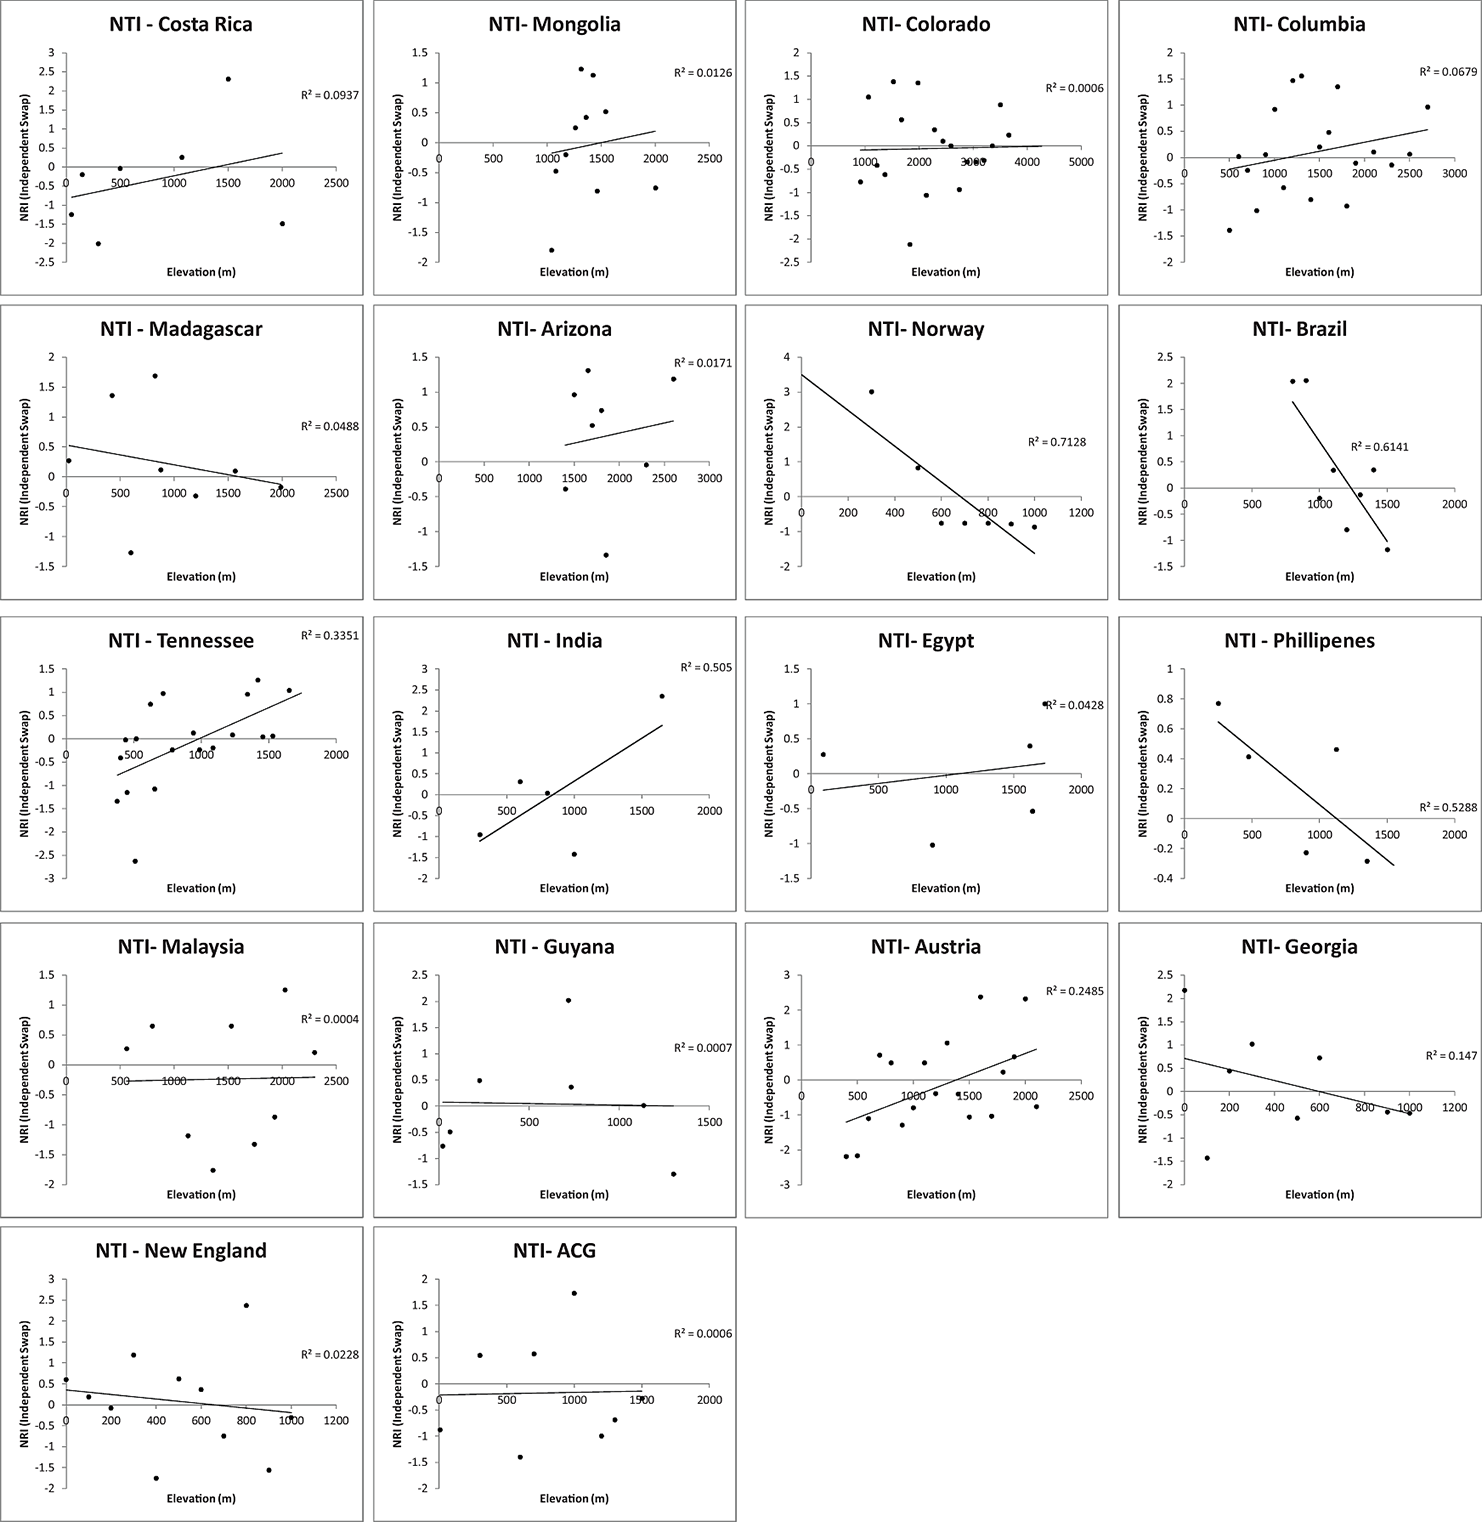
Fig. A5B. The relationship between elevation and phylogenetic community structure: phylogenetic commutity structure as NTI.
Fig. A6. Environmental co-variates with beta diversity. BIO1-11 are measures of temperature while BIO12-19 are measures of preciptation. To aid in visualising the relationship between beta diversity and these environmental data points we smoothed using the non-parametric method LOESS (Cleveland and Loader 1996). BIO1 = Annual Mean Temperature, BIO2 = Mean Diurnal Range (Mean of monthly (max temp - min temp)), BIO3 = Isothermality (BIO2/BIO7) (* 100), BIO4 = Temperature Seasonality (standard deviation *100), BIO5 = Max Temperature of Warmest Month, BIO6 = Min Temperature of Coldest Month, BIO7 = Temperature Annual Range (BIO5-BIO6), BIO8 = Mean Temperature of Wettest Quarter, BIO9 = Mean Temperature of Driest Quarter, BIO10 = Mean Temperature of Warmest Quarter, BIO11 = Mean Temperature of Coldest Quarter, BIO12 = Annual Precipitation, BIO13 = Precipitation of Wettest Month, BIO14 = Precipitation of Driest Month, BIO15 = Precipitation Seasonality (Coefficient of Variation), BIO16 = Precipitation of Wettest Quarter, BIO17 = Precipitation of Driest Quarter, BIO18 = Precipitation of Warmest Quarter, BIO19 = Precipitation of Coldest Quarter.