Ecological Archives C006-064-A1
Heather R. Whittington, David Tilman, Peter D. Wragg, and Jennifer S. Powers. 2015. Phenological responses of prairie plants vary among species and year in a three-year experimental warming study. Ecosphere 6:208. http://dx.doi.org/10.1890/es15-00070.1
Appendix A. Experimental warming effects on soil temperature, moisture, and plant phenology in a three-year study in a Minnesota prairie.
Table A1. Mean values of population level reproductive variables by species and year. Values in parentheses indicate standard error. Dates are given as Julian Day. Values in bold indicate significant differences between at least two years (p < 0.0056 (Bonferroni adjusted), least square mean differences after ANOVA).
Species |
Year |
FFD |
Peak flowering date |
Length of flowering season (wk) |
Amorpha |
2009 |
191.3 (1.1) |
196.6 (0.9) |
2.71 (0.23) |
2010 |
188.1 (1.7) |
192.3 (1.8) |
2.11 (0.18) |
|
2011 |
189.7 (1.2) |
192.0 (0.9) |
1.88 (0.20) |
|
Andropogon |
2009 |
208.7 (0.9) |
217.3 (0.7) |
3.48 (0.19) |
2010 |
195.2 (1.1) |
211.9 (1.5) |
4.88 (0.16) |
|
2011 |
203.2 (0.4) |
218.0 (1.3) |
6.69 (0.21) |
|
Dalea |
2009 |
198.0 (1.3) |
205.7 (1.2) |
3.36 (0.23) |
2010 |
198.5 (1.5) |
201.3 (1.5) |
1.95 (0.21) |
|
2011 |
198.7 (1.0) |
203.8 (0.4) |
2.75 (0.15) |
|
Koeleria |
2009 |
162.6 (1.4) |
165.7 (1.2) |
1.89 (0.23) |
2010 |
160.1 (1.1) |
163.0 (1.2) |
1.80 (0.25) |
|
2011 |
167.5 (1.0) |
169.2 (0.8) |
1.29 (0.13) |
|
Lespedeza |
2009 |
219.4 (1.6) |
224.0 (1.2) |
2.38 (0.14) |
2010 |
213.4 (1.2) |
217.8 (1.2) |
1.97 (0.14) |
|
2011 |
214.3 (1.3) |
224.0 (0.8) |
3.19 (0.26) |
|
Liatris |
2009 |
242.9 (2.4) |
249.2 (2.5) |
2.35 (0.31) |
2010 |
236.2 (2.6) |
249.1 (2.5) |
3.84 (0.29) |
|
2011 |
246.3 (1.6) |
254.4 (1.4) |
3.18 (0.27) |
|
Lupinus |
2009 |
140.2 (0.6) |
152.5 (0.4) |
4.91 (0.08) |
2010 |
133.2 (0.9) |
142.8 (0.9) |
4.21 (0.19) |
|
2011 |
144.7 (0.8) |
154.4 (0.7) |
4.21 (0.16) |
|
Poa |
2009 |
149.2 (0.6) |
161.7 (1.0) |
3.39 (0.18) |
2010 |
144.7 (0.5) |
151.8 (0.5) |
3.12 (0.16) |
|
2011 |
153.7 (0.5) |
156.1 (0.3) |
2.09 (0.16) |
|
Schizachyrium |
2009 |
230.5 (1.4) |
242.3 (1.6) |
3.19 (0.30) |
2010 |
209.3 (1.2) |
222.5 (1.2) |
3.03 (0.14) |
|
2011 |
216.1 (0.8) |
222.5 (1.2) |
3.71 (0.17) |
|
Solidago* |
2010 |
229.5 (1.4) |
235.5 (1.5) |
2.64 (0.27) |
2011 |
230.3 (1.5) |
240.9 (1.6) |
3.52 (0.31) |
|
* Species not included in statistical analyses |
||||
Table A2. Mean values of individual level reproductive phenological variables by species and year. Values in parentheses indicate standard error. Dates are given as Julian Day. Values in bold indicate significant differences between at least two years (p < 0.0056 (Bonferroni adjusted), least square mean differences after ANOVA).
Species |
Year |
Bud Date |
Flower Date |
Flowering duration (wk) |
Amorpha |
2009 |
172.5 (1.6) |
196.8 (1.4) |
1.82 (0.14) |
2010 |
154.3 (2.5) |
194.4 (1.9) |
1.29 (0.09) |
|
2011 |
165.8 (1.1) |
190.6 (1.0) |
1.55 (0.11) |
|
Andropogon* |
2009 |
208.2 (1.7) |
221.6 (1.3) |
1.33 (0.13) |
2010 |
197.2 (1.9) |
213.2 (1.9) |
1.67 (0.11) |
|
2011 |
190.8 (1.2) |
211.8 (1.3) |
2.33 (0.13) |
|
Dalea |
2009 |
178.3 (0.7) |
204.6 (1.1) |
1.82 (0.10) |
2010 |
169.4 (2.0) |
204.7 (2.0) |
1.32 (0.11) |
|
2011 |
176.3 (0.8) |
200.4 (0.7) |
1.88 (0.09) |
|
Koeleria |
2009 |
140.0 (0.0) |
165.5 (0.7) |
1.85 (0.15) |
2010 |
138.3 (2.8) |
160.1 (1.1) |
1.70 (0.26) |
|
2011 |
149.4 (1.2) |
169.4 (0.7) |
1.06 (0.06) |
|
Lespedeza* |
2009 |
200.5 (1.0) |
228.5 (1.3) |
1.79 (0.19) |
2010 |
167.4 (1.6) |
220.2 (0.9) |
-- |
|
2011 |
170.8 (1.2) |
221.4 (1.1) |
1.80 (0.11) |
|
Liatris |
2009 |
208.6 (3.2) |
247.4 (1.9) |
2.39 (0.22) |
2010 |
178.3 (1.9) |
236.9 (2.7) |
4.09 (0.31) |
|
2011 |
185.6 (1.3) |
246.5 (1.5) |
2.70 (0.21) |
|
Lupinus |
2009 |
132.5 (0.8) |
149.2 (0.7) |
2.24 (0.09) |
2010 |
123.1 (1.1) |
141.5 (0.8) |
1.5 (0.10) |
|
2011 |
140.0 (0.8) |
150.0 (0.6) |
2.18 (0.11) |
|
Poa |
2009 |
137.1 (1.5) |
154.3 (1.6) |
1.6 (0.22) |
2010 |
133.9 (1.0) |
151.2 (1.7) |
1.53 (0.14) |
|
2011 |
137.0 (1.5) |
156.6 (0.4) |
1.07 (0.07) |
|
Schizachyrium* |
2009 |
229.3 (1.1) |
236.0 (1.1) |
1.42 (0.16) |
2010 |
202.3 (1.1) |
219.8 (1.2) |
1.58 (0.10) |
|
2011 |
-- |
220.1 (1.1) |
1.67 (0.10) |
|
Solidago* |
2010 |
204.8 (1.9) |
229.4 (1.3) |
2.82 (0.30) |
2011 |
-- |
232.1 (1.2) |
2.73 (0.11) |
|
* Species not included in some or all statistical analyses (see methods) |
||||
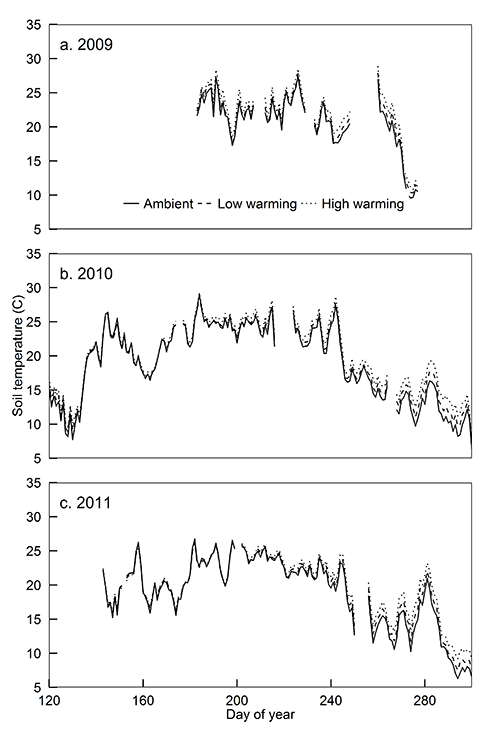
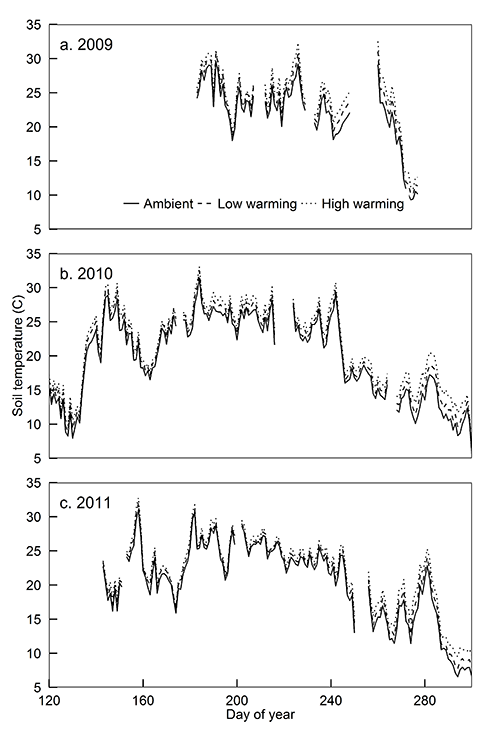
Fig. A1. Effects of warming treatments on daily mean soil temperature (mean ±SE, measured at a depth of 1 cm) in 4-species plots, through each of three growing seasons.
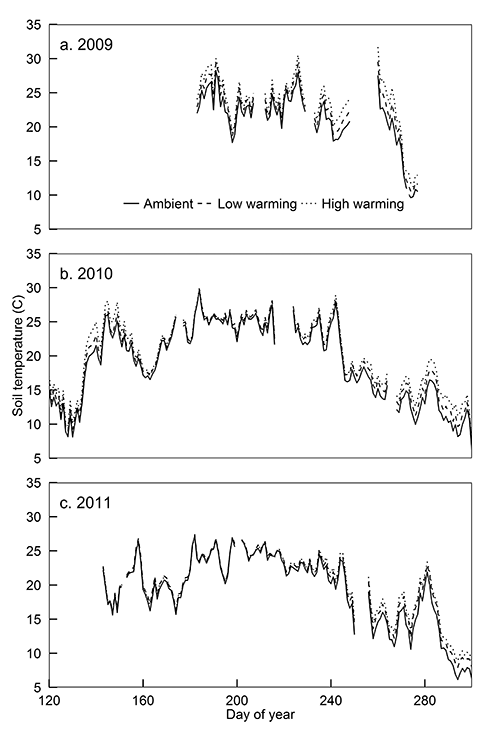
Fig. A2. Effects of warming treatments on daily mean soil temperature (mean ± SE, measured at a depth of 1 cm) in 16-species plots, through each of three growing seasons.
Fig. A3. Effects of warming treatments on daily mean soil temperature (mean ± SE, measured at a depth of 1 cm) in 32-species plots, through each of three growing seasons.
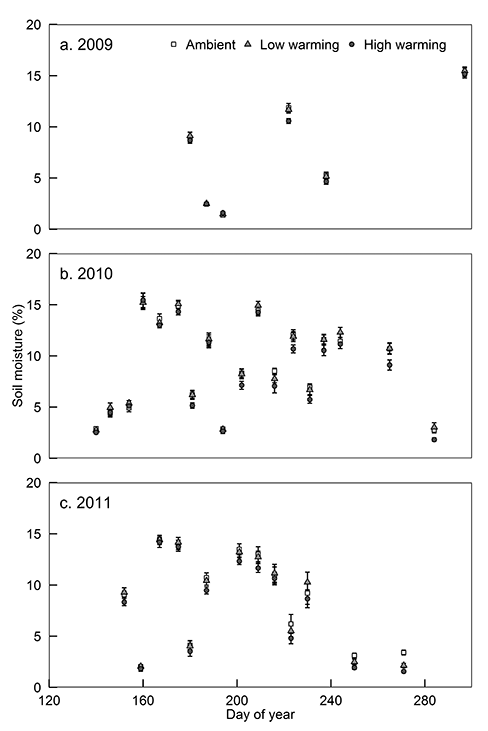
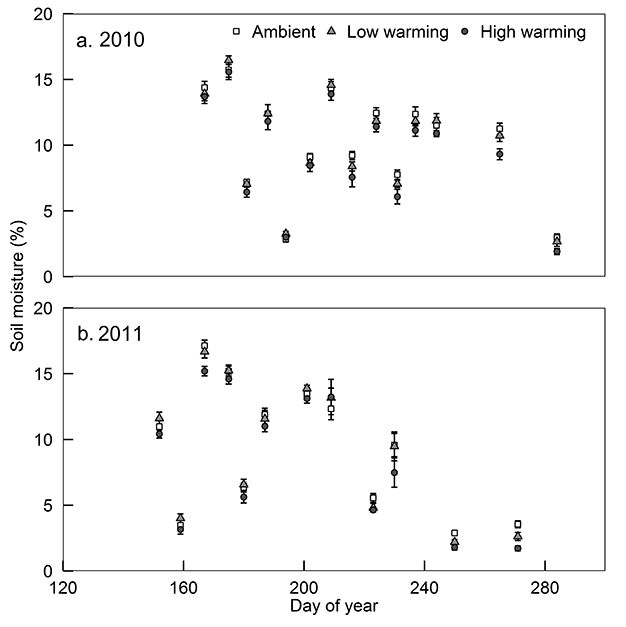
Fig. A4. Effects of warming treatments on soil moisture content in 4-species plots, through each of three growing seasons (mean ±SE, measured from the surface to 6 cm depth at ten points in each subplot using a Thetaprobe ML2 soil moisture sensor (Dynamax, Houston, TX, USA)).
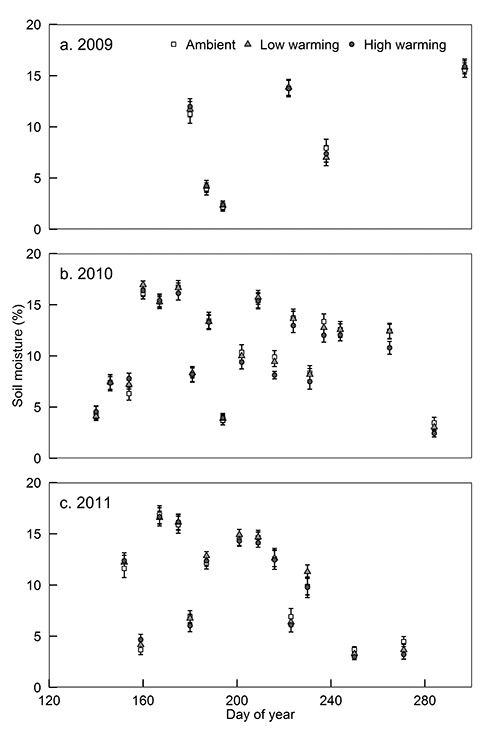
Fig. A5. Effects of warming treatments on soil moisture content in 16-species plots, through each of three growing seasons (mean ±SE, methods as described for Appendix Fig. A4).
Fig. A6. Effects of warming treatments on soil moisture content in 32-species plots, through each of two growing seasons (mean ±SE, methods as described for Appendix Fig. A4).
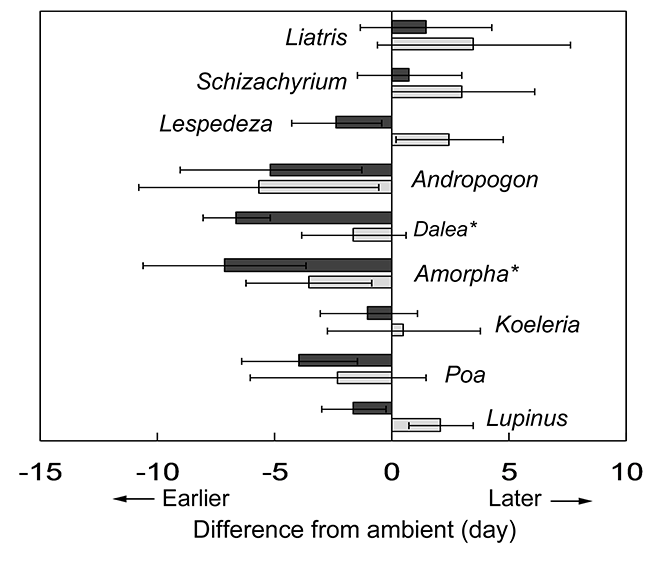
Fig. A7. Difference in budding of tagged individuals in warmed subplots compared to ambient subplots for each species. Black bars denote difference under high warming and light gray bars denote difference under low warming. * indicates significant difference (p < 0.006 (Bonferroni adjusted), least square differences after ANOVA) between high warming treatment and ambient controls. Error bars indicate standard error of the mean difference.
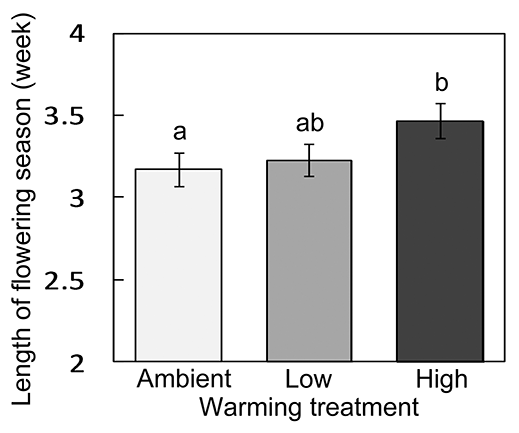
Fig. A8. Warming treatment effect on length of flowering season at the population level, averaged across three years. Letters indicate significant differences between treatments (p < 0.05, post-hoc Tukey’s HSD after ANOVA). Error bars indicate standard error of the mean.
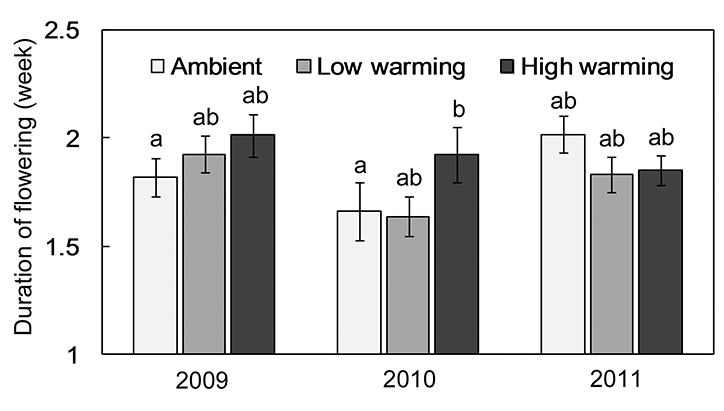
Fig. A9. Warming treatment effect on the duration of flowering of tagged individuals for three years. Letters indicate significant differences between treatments (p < 0.05, post-hoc Tukey’s HSD after ANOVA). Error bars indicate standard error of the mean.