Ecological Archives C006-060-A1
Laura A. Burkle, Jonathan A. Myers, and R. Travis Belote. 2015. Wildfire disturbance and productivity as drivers of plant species diversity across spatial scales. Ecosphere 6:202. http://dx.doi.org/10.1890/es15-00438.1
Appendix A. A table showing the effects of fire severity (mixed severity, high severity, unburned) on overall species composition of all plants, forbs, graminoids, and woody plants in sites Helena (low productivity), Paradise Valley (medium productivity), and Whitefish (high productivity); a table showing tree abundance among fire-severities and sites; and figures showing boxplots of fire severity in mixed-severity and high-severity fire transects in the study sites, ordination of plant species composition (Bray-Curtis similarity based on raw abundance data) in unburned transects derived from nonmetric multi-dimensional scaling, species accumulation curves and ordination of plant species compositionin unburned, mixed-severity fire, and high-severity fire communities in Helena, Paradise Valley, and Whitefish for forbs, graminoids, and woody plants, and boxplots of the effects of wildfire severity on community dispersion (distance-to-centroids) of forbs, graminoids, and woody plants in Helena, Paradise Valley, and Whitefish.
Table A1. Effects of fire severity (mixed severity, high severity, unburned) on overall species composition of all plants, forbs, graminoids, and woody plants in sites Helena (low productivity), Paradise Valley (medium productivity), and Whitefish (high productivity). Species composition was calculated using Bray Curtis dissimilarities. DF = degrees of freedom (numerator, total). P-values < 0.05 are highlighted in bold.
Site |
df |
Species composition |
|
|
|
F |
P |
Helena |
|
|
|
All plants |
2,51 |
4.02 |
0.002 |
Forbs |
2,51 |
3.68 |
0.002 |
Graminoids |
2,51 |
3.47 |
0.002 |
Woody plants |
2,42 |
1.88 |
0.004 |
Paradise |
|
|
|
All plants |
2,51 |
9.09 |
0.002 |
Forbs |
2,51 |
10.24 |
0.002 |
Graminoids |
2,48 |
4.89 |
0.002 |
Woody plants |
2,51 |
7.02 |
0.002 |
Whitefish |
|
|
|
All plants |
2,51 |
7.15 |
0.002 |
Forbs |
2,51 |
6.36 |
0.002 |
Graminoids |
2,51 |
1.36 |
0.16 |
Woody plants |
2,51 |
11.19 |
0.002 |
Table A2. Tree abundance (mean ±1 standard error) among fire-severities and sites. Abundances of smll trees (0–20 cm DBH) were measured in 50 m² band transects, and abundances of large trees (> 20 cm DBH) were measured in 491 m² circular plots centered on each transect.
|
|
Diameter at breast height (cm) |
|||||
Site |
Fire-severity |
0–5 |
5–10 |
10–20 |
20–30 |
30–40 |
>40 |
Helena |
|
|
|
|
|
|
|
|
unburned |
1.67±0.50 |
1.06±0.32 |
0.5±0.20 |
3.33±0.71 |
1.39±0.31 |
1.56±0.34 |
|
mixed |
0.67±0.35 |
0.44±0.28 |
0.17±0.12 |
1.17±0.34 |
1.22±0.53 |
0.61±0.36 |
|
high |
0±0 |
0±0 |
0±0 |
0.18±0.18 |
0.06±0.06 |
0±0 |
Paradise |
|
|
|
|
|
|
|
|
unburned |
3.89±1.0 |
1.5±0.62 |
2±0.80 |
9.17±1.17 |
3.39±0.57 |
3.33±0.68 |
|
mixed |
0.39±0.33 |
0.11±0.11 |
0.17±0.17 |
0.28±0.23 |
0±0 |
0±0 |
|
high |
0±0 |
0±0 |
0.11±0.11 |
0.11±0.11 |
0±0 |
0±0 |
Whitefish |
|
|
|
|
|
|
|
|
unburned |
2.33±0.55 |
0.83±0.27 |
1.0±0.39 |
4.72±0.83 |
3.83±0.78 |
1.39±0.44 |
|
mixed |
2.83±1.38 |
0.17±0.09 |
0.39±0.16 |
1.5±0.62 |
0.56±0.30 |
0.28±0.14 |
|
high |
35.72±7.08 |
1.28±0.55 |
0.11±0.08 |
0.06±0.06 |
0±0 |
0.06±0.06 |
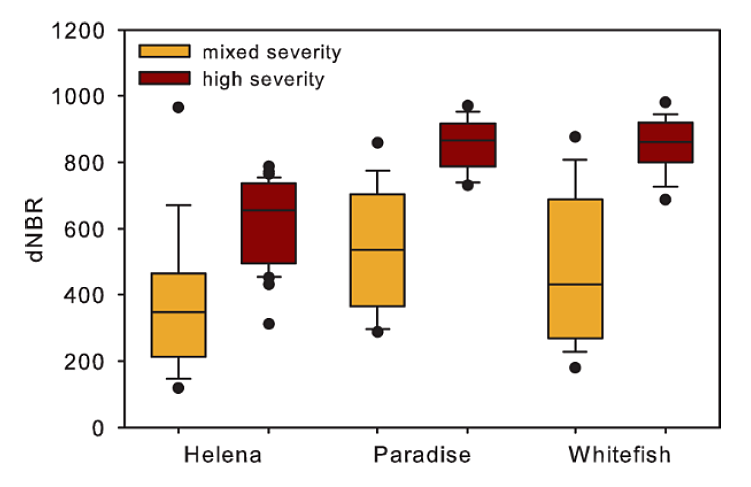
Fig. A1. Boxplots of fire severity in mixed-severity and high-severity fire transects in the study sites. Remotely sensed burn severity data (30-m resolution) were obtained from the Monitoring Trends in Burn Severity (MTBS) program. MTBS data are produced from Landsat imagery and quantify short-term fire effects (Eidenshink et al. 2007). Differenced normalized burn ratio (dNBR) data are a measure of pre- to post-fire spectral change calculated using near-infrared and shortwave infrared ranges (Eidenshink et al. 2007) and is related to changes in biomass (both living and non-living), level of scorch, char, ash, and soil exposure (Cansler and McKenzie 2012). Mixed-severity fire, as expected, had a wider range of variation than high-severity fire at each of the sites. The standard deviation for mixed-severity transects was always greater than high-severity transects across each site (SD = 49, 48, and 108 in mixed-severity compared to SD = 21, 38, and 40 in high-severity in Helena, Paradise, and Whitefish, respectively).
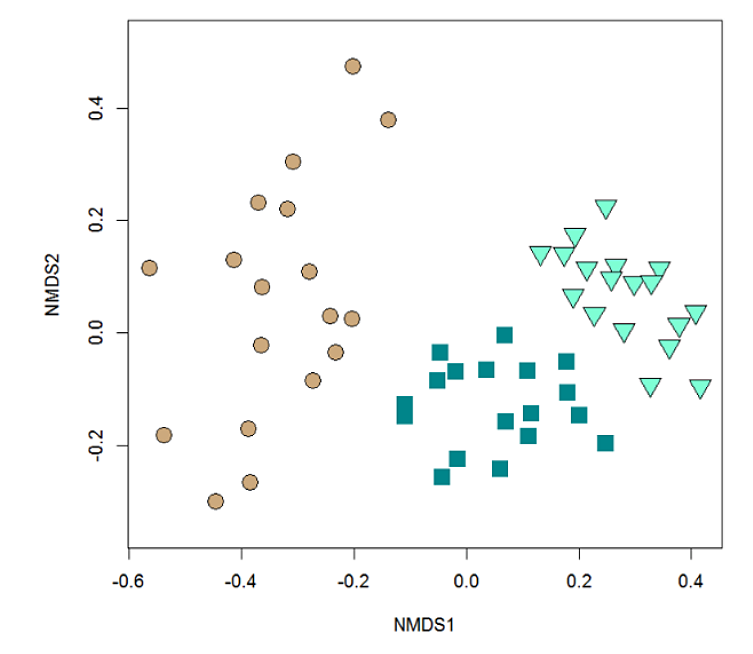
Fig. A2. Ordination of plant species composition (Bray-Curtis similarity based on raw abundance data) in unburned transects derived from nonmetric multi-dimensional scaling (NMDS; stress = 16.01).
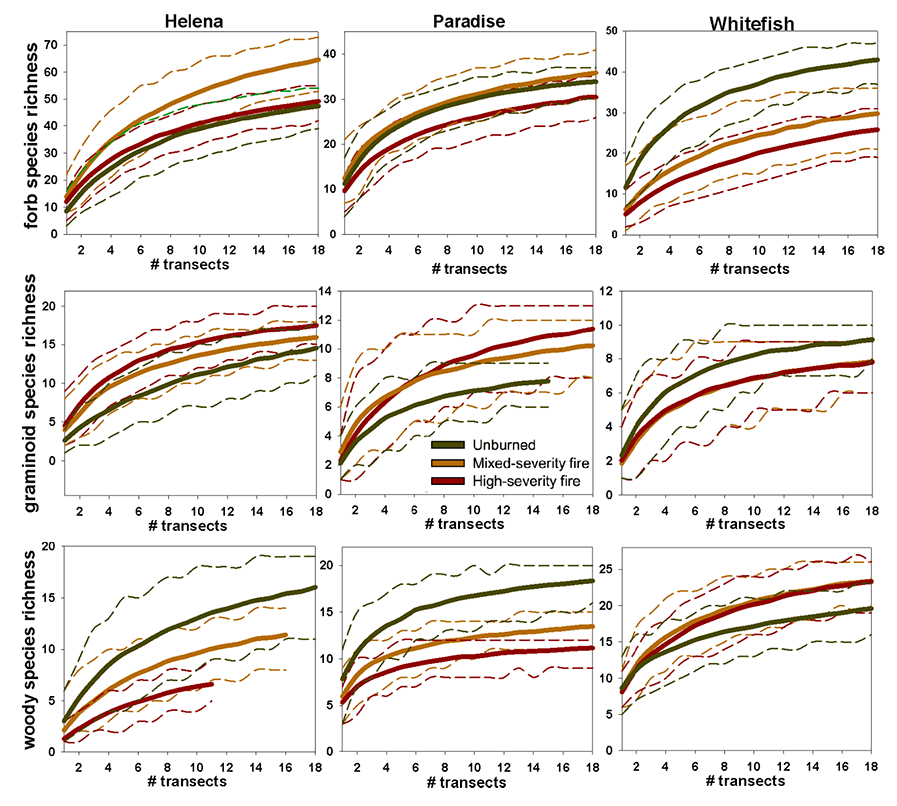
Fig. A3. Species accumulation curves in unburned (green), mixed-severity fire (orange), and high-severity fire (red) communities (N = 18 transects per burn level) in Helena (low productivity), Paradise Valley (medium productivity), and Whitefish (high productivity) for forbs, graminoids, and woody plants. Dashed lines represent 95% confidence intervals. Curves were produced using EcoSim 7.72 (Gotelli and Entsminger 2004).
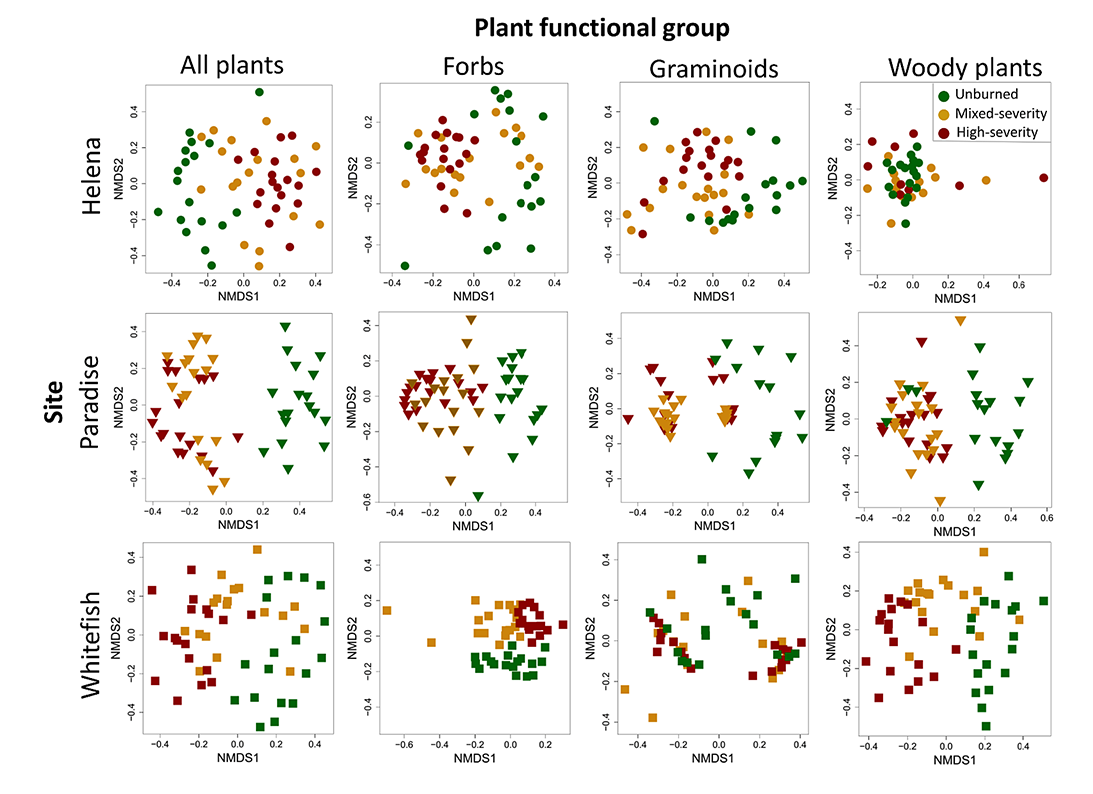
Fig. A4. Ordination of plant species composition (Bray-Curtis similarity based on raw abundance data) in unburned (green), mixed-severity fire (orange), and high-severity fire (red) communities (N = 18 transects per burn level) in Helena (low productivity), Paradise Valley (medium productivity), and Whitefish (high productivity). Axes are derived from nonmetric multi-dimensional scaling (NMDS; stress < 16 for all ordinations).
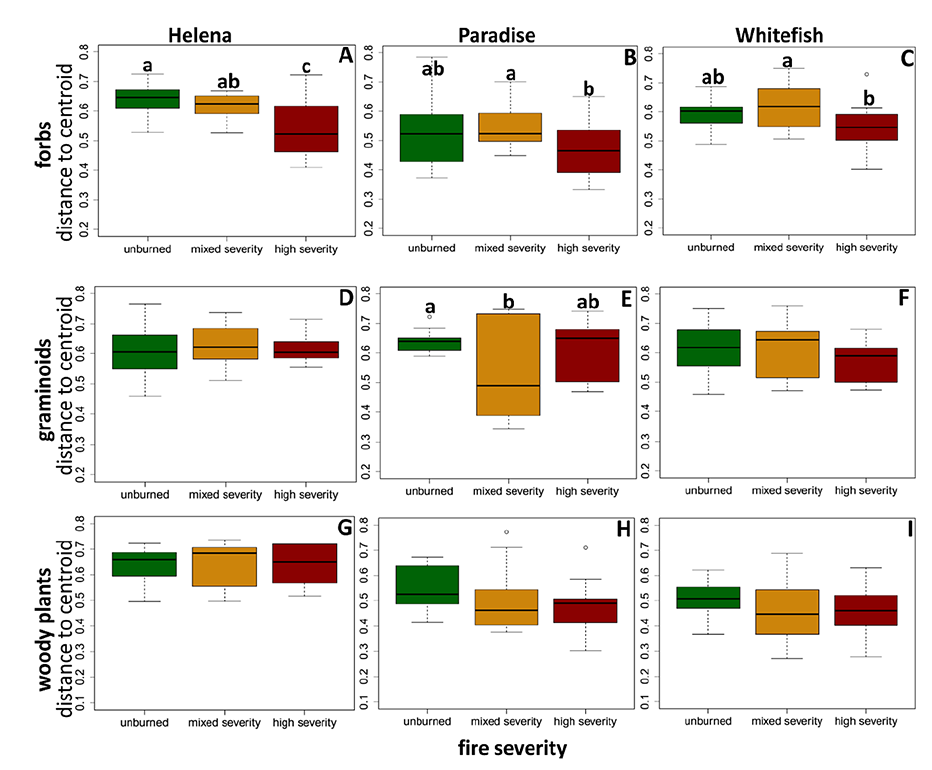
Fig. A5. Boxplots of the effects of wildfire severity on community dispersion (distance-to-centroids) of forbs, graminoids, and woody plants in Helena (low productivity), Paradise Valley (medium productivity), and Whitefish (high productivity). Letters above bars indicate significant differences in community dispersion (P < 0.05) among levels of fire severity within a site based on Tukey’s tests; missing letters indicate no differences among levels of fire severity within a site. Distance-to-centroids were calculated using Jaccard dissimilarities.
Literature Cited
Cansler, C. A., and D. McKenzie. 2012. How robust are burn severity indices when applied in a new region? Evaluation of alternate field-based and remote-sensing methods. Remote Sensing 4:456–483.
Eidenshink, J., B. Schwind, K. Brewer, Z. Zhu, B. Quayle, and S. Howard. 2007. A project for monitoring trends in burn severity. Fire Ecology 3 (1): 3-21. Fire Ecology Special Issue Vol 3:4.
Gotelli, N. J., and G. L. Entsminger. 2004. EcoSim: Null models software for ecology. Version 7. Acquired Intelligence and Kesey-Bear, Jerico, VT 05465. http://garyentsminger.com/ecosim/index.htm.