Ecological Archives C006-055-A1
Marcos Texeira, Mariano Yarzabal, Gervasio Pineiro, Santiago Baeza, and Jose Maria Paruelo . 2015. Land cover and precipitation controls over long-term trends in carbon gains in the grassland biome of South America. Ecosphere 6:196. http://dx.doi.org/10.1890/es15-00085.1
Appendix A. Additional information from the land cover characterization for Uruguay.
In this appendix we show additional information regarding the land cover characterization for Uruguay: ground truth points used to build the land cover characterization (Figure A1) and confusion matrix derived from the classification (Table A1).
Table A1. Confusion matrices derived from the land cover characterization for Uruguay (a) in number of pixels, (b) in percent of total pixels. “SC” stands for Summer crops, “WSC” stands for Winter-Summer Crops, “R” stands for rangelands and “TPF” stands for tree plantations and forests. The Kappa coefficient associated to these matrices is 0.8571 and the overall accuracy is 89.6%.
a |
Ground Truth (number of pixels) |
|||||
SC |
WSC |
R |
TPF |
Total |
||
Class |
Unclassified |
0 |
0 |
0 |
0 |
0 |
Class 1 |
1146 |
81 |
106 |
5 |
1338 |
|
Class 2 |
78 |
594 |
14 |
7 |
693 |
|
Class 3 |
108 |
6 |
1313 |
14 |
1441 |
|
Class 4 |
3 |
0 |
26 |
808 |
837 |
|
Total |
1335 |
681 |
1459 |
834 |
4309 |
|
b |
Ground Truth (percent of pixels) |
|||||
SC |
WSC |
R |
TPF |
Total |
||
Class |
Unclassified |
0 |
0 |
0 |
0 |
0 |
Class 1 |
85.84 |
11.89 |
7.27 |
0.60 |
31.05 |
|
Class 2 |
5.84 |
87.22 |
0.96 |
0.84 |
16.08 |
|
Class 3 |
8.09 |
0.88 |
89.99 |
1.68 |
33.44 |
|
Class 4 |
0.22 |
0 |
1.78 |
96.88 |
19.42 |
|
Total |
100.00 |
100.00 |
100.00 |
100.00 |
100.00 |
|
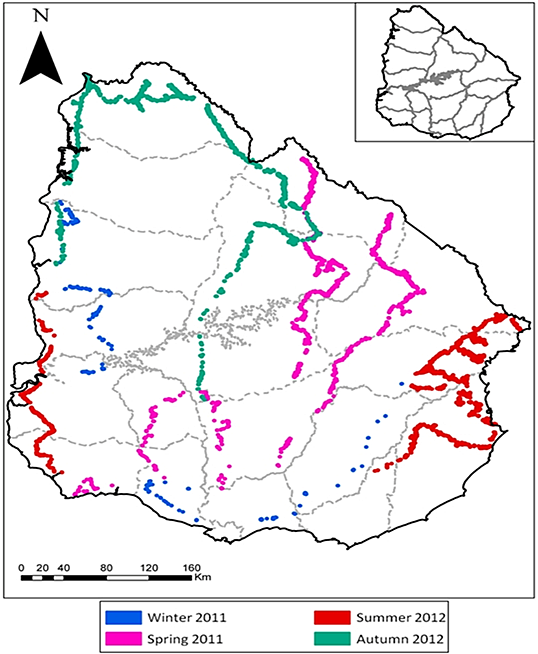
Fig. A1. Ground truth points recorded during 2011 and 2012 to build pheonological signatures used in the characterization of land cover for Uruguay. In each of the 4309 points, land cover was recorded and then used in the land cover characterization (see Methods, section 4.1.3). Political divisions (“Departamentos”) are shown in the map.