Ecological Archives C006-053-A2
Philip G. Hahn and John L. Orrock. 2015. Spatial arrangement of canopy structure and land-use history alter the effect that herbivores have on plant growth. Ecosphere 6:193. http://dx.doi.org/10.1890/es15-00036.1
Appendix B. Analysis of the growth of plants within full exclosures.
Table B1. ANOVA table for the analysis of plants grown within full herbivore exclosures. Values are F values. We used a four-way mixed-model ANOVA with land-use history, overstory tree thinning, thinning in the adjacent patch, and distance from the edge as fixed effects. We used a four-way ANOVA in order to focus on potential main effects of land-use history and canopy structure, in addition to potential edges effects.
Effect |
Den df |
C. bellidifolius |
Se. tortifolius |
So. nemoralis |
So. odora |
Land-use history |
14 |
0.07 |
1.45 |
0.91 |
0.32 |
Overstory tree thinning |
26 |
44.35* |
31.64* |
52.18* |
19.83* |
Landuse×Thinning |
26 |
8.27* |
11.12* |
2.46 |
1.36 |
Adjacent patch thinning |
26 |
0.25 |
0.77 |
1.09 |
0 |
Land-use×Adj |
26 |
2.12 |
1.79 |
1.16 |
1.01 |
Thinning×Adj |
26 |
0 |
2.4 |
0.64 |
0.34 |
Landuse×Thin×Adj |
26 |
0 |
0.04 |
0.05 |
0.53 |
Distance from edge |
58 |
0.87 |
0.82 |
1.56 |
0.04 |
Landuse×Dist |
58 |
4.54 |
0.63 |
0.01 |
1.91 |
Thinning×Dist |
58 |
0.08 |
3.5 |
1.43 |
0.08 |
Landuse×Thinning×Dist |
58 |
2.94 |
1.76 |
0.25 |
2.08 |
Adj×Dist |
58 |
1.95 |
0.25 |
0.86 |
0.14 |
Landuse×Adj×Dist |
58 |
0.05 |
0.46 |
0.33 |
3.07 |
Thinning×Adj×Dist |
58 |
3.18 |
0.46 |
0.67 |
0.31 |
Lduse×Thin×Adj×Dist |
58 |
0.43 |
0.13 |
0.44 |
1.09 |
*P ≤ 0.05.
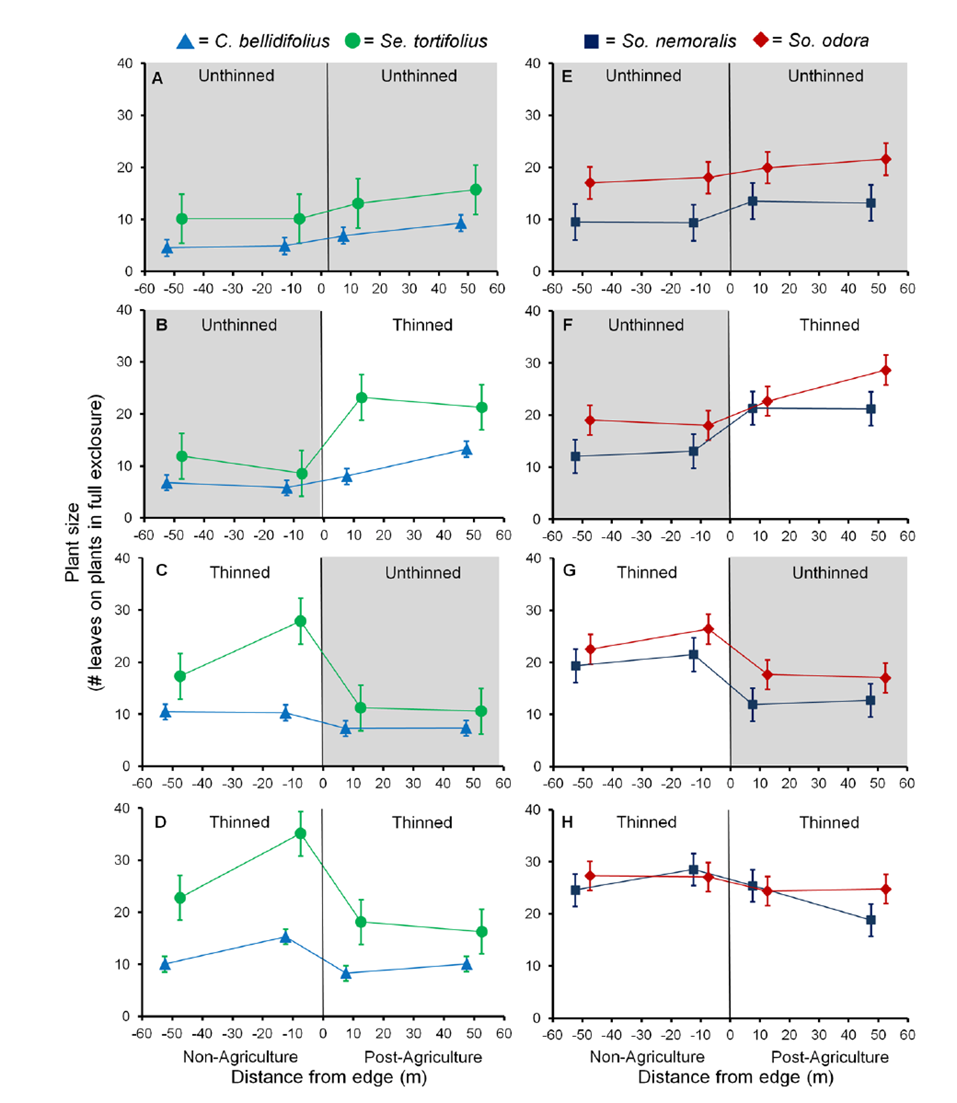
Fig. B1. Total number of leaves produced in one growing season on plants protected from herbivores. Data are jittered around distance for clarity. Error bars are ±1 SE.