Ecological Archives C006-049-A1
Sarah R. Supp, David N. Koons, and S. K. Morgan Ernest. 2015. Using life history trade-offs to understand core-transient structuring of a small mammal community. Ecosphere 6:187. http://dx.doi.org/10.1890/es15-00239.1
Appendix A. Figures showing the species-level movement distances calculated from the recapture data, observed yearly reproductive effort for individuals of each species from the field study, PCA biplot with confidence ellipses for phylogenetic relatedness at the family level, apparent survival estimates (Φ) shown against the log(Y+1) distance (benchmark) moved for each species and probability of moving a relatively long distance (ψ) as estimated using RMark, and movement estimates (benchmark, ψ) shown against fecundity for each species. Evidence for a reproduction-movement trade-off is not statistically significant.
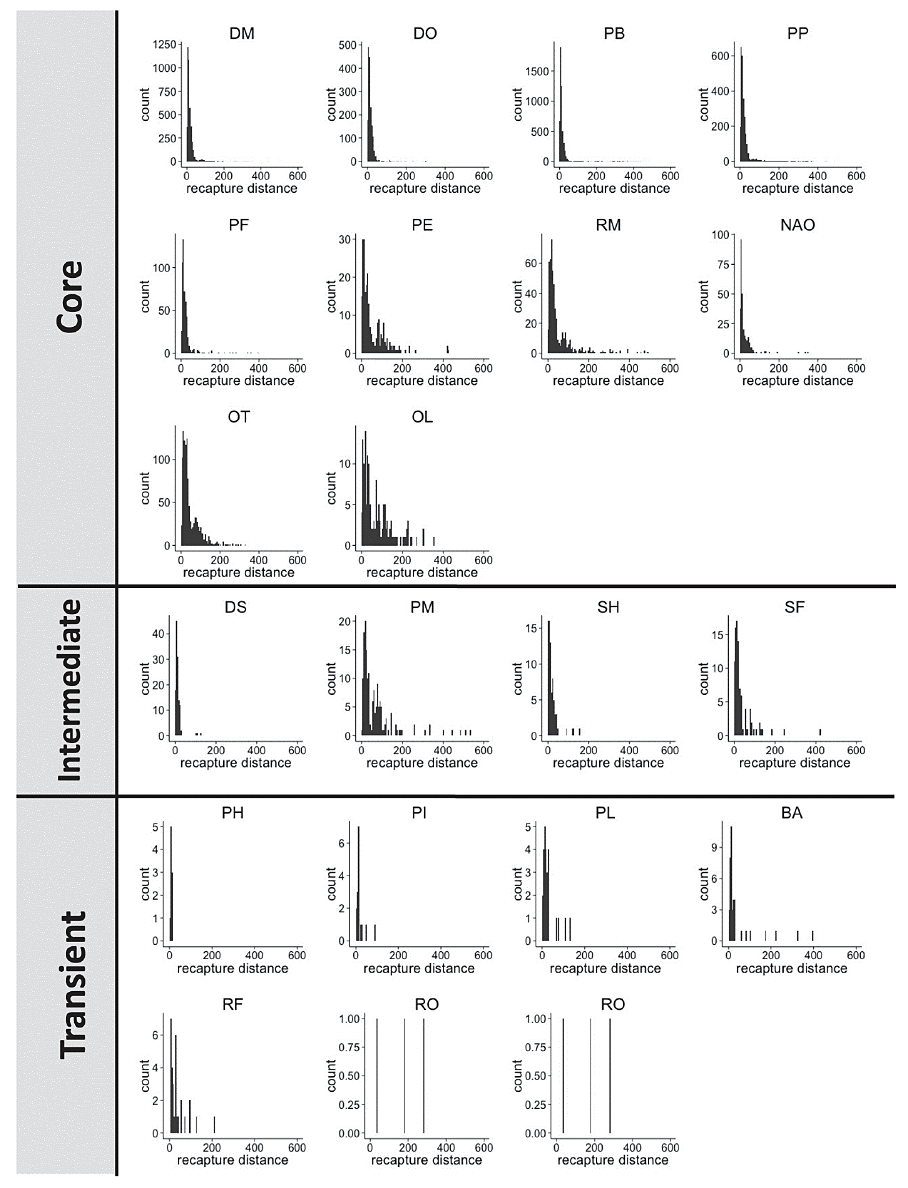
Fig. A1. Panels showing the species-level movement distances calculated from the recapture data. Two-letter species name abbreviations are as follows from Fig. 2.
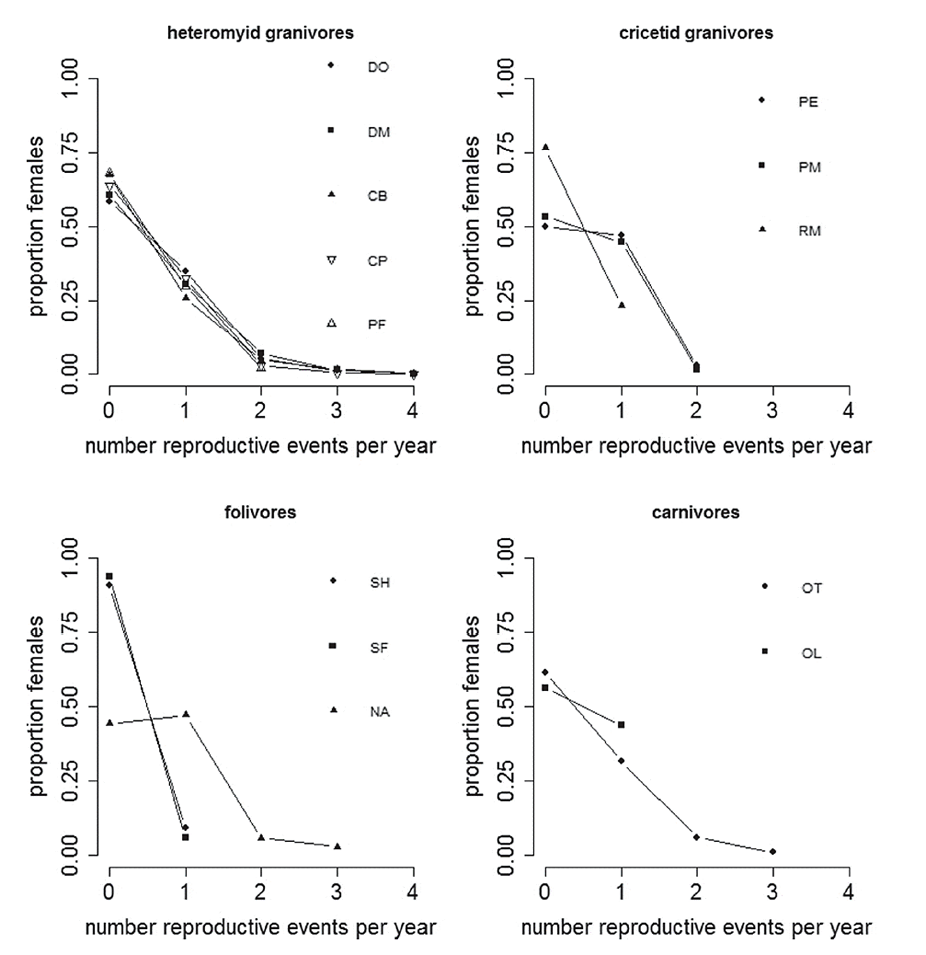
Fig. A2. Observed yearly reproductive effort for individuals of each species from the field study. The y-axis represents the proportion females that we tracked that were recorded in reproductive condition 0–4 times per calendar year (no individuals were recorded as having > 4reproductive events within a calendar year). Two-letter species name abbreviations are as follows from Fig. 2.
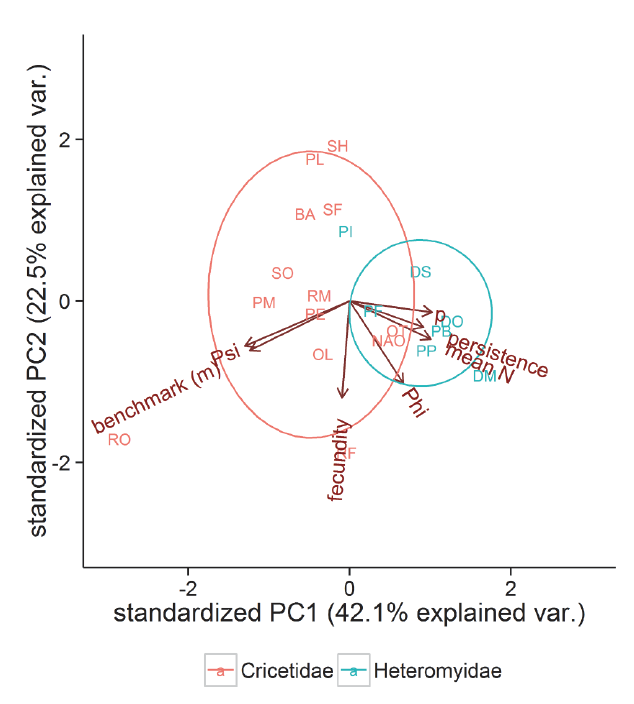
Fig. A3. PCA biplot with confidence ellipses for phylogenetic relatedness at the family level. The relationship of movement (Psi, benchmark), mean number of reproductive events individuals of a species had per year (fecundity), apparent survival (Phi), recapture rates (p), mean abundance, and the proportion of years a species was present (persistence). Two letter abbreviations refer to species names as presented in Fig. 2. PCA axes 1 and 2 explained a total of 64.6% of the variation.
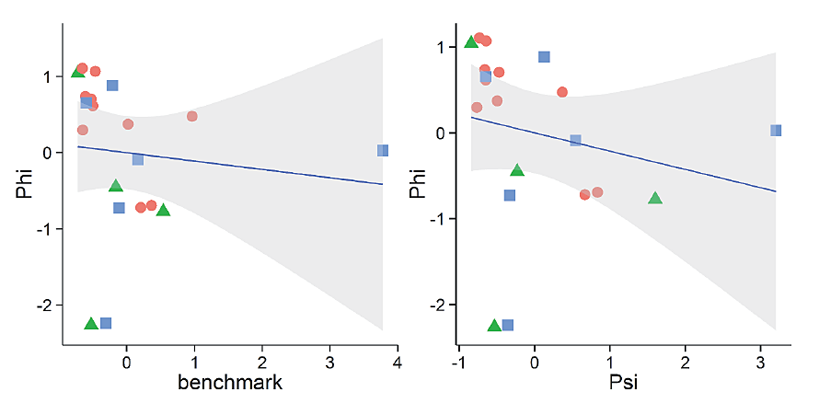
Fig. A4. Apparent survival estimates (Φ) shown against the log(Y+1) distance (benchmark) moved for each species and probability of moving a relatively long distance (ψ) as estimated using RMark. The plotted variables have been standardized. Points represent core (pink circles), intermediate (green triangles) and transient (blue squares) species.
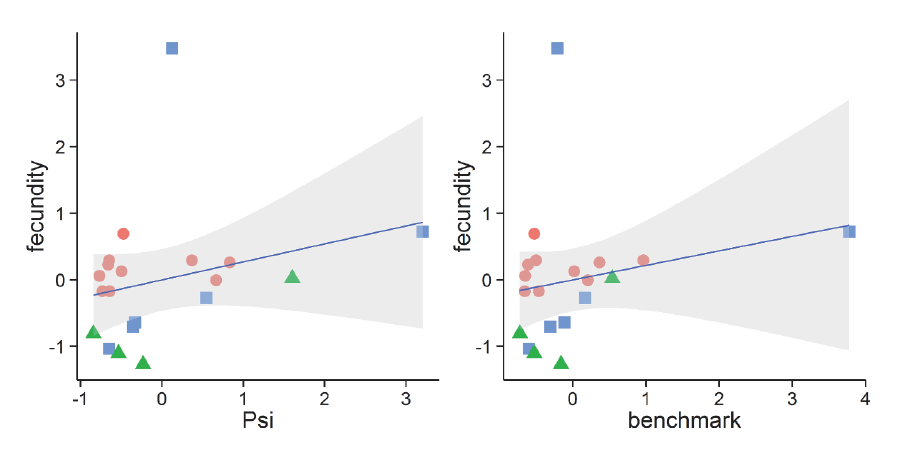
Fig. A5. Movement estimates (benchmark, ψ) shown against fecundity for each species. Evidence for a reproduction-movement trade-off is not statistically significant. The plotted variables have been standardized. Points represent core (pink circles), intermediate (green triangles) and transient (blue squares) species.
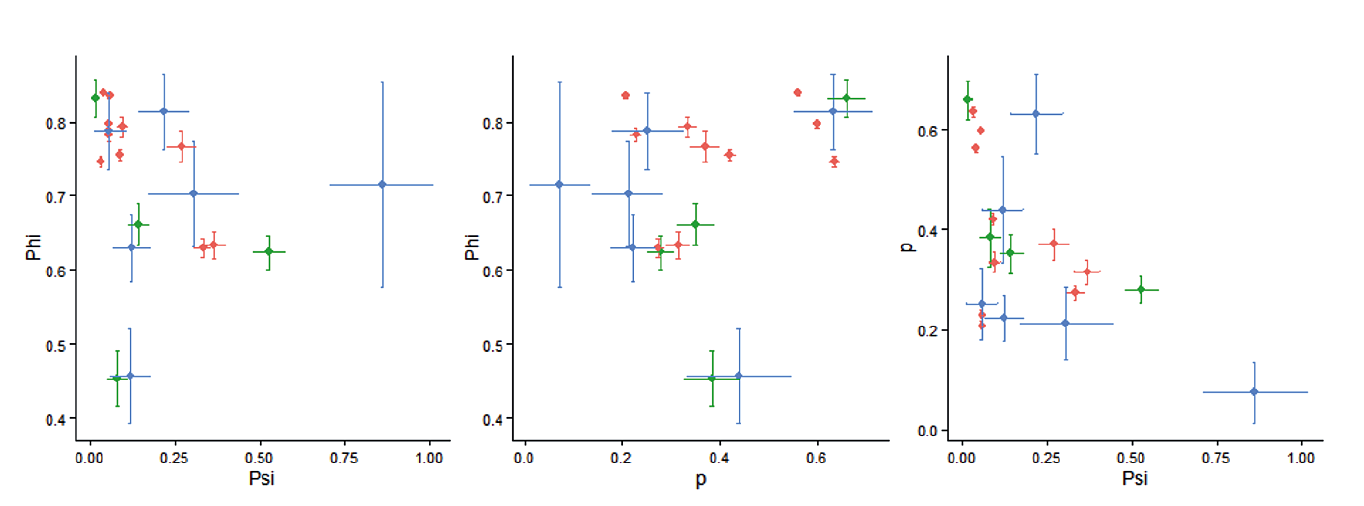
Fig. A6. Relationship between the CMR estimates for apparent survival (Phi), movement (Psi) and recapture (p) probability from the CMR analysis for each species, plotted with error bars representing standard error for each estimate. Points represent core (pink), intermediate (green) and transient (blue) species. Note that the transient species have the largest error bars.