Ecological Archives C006-037-A1
C. Leclerc, C. Bellard, G. M. Luque, and F. Courchamp. 2015. Overcoming extinction: understanding processes of recovery of the Tibetan antelope. Ecosphere 6:171. http://dx.doi.org/10.1890/es15-00049.1
Appendix A. Tables and figures regarding Tibetan antelope population size and dynamics.
Table A1. Data of Tibetan antelope population size.
Year |
Population size |
References |
1950 |
1,000,000 |
(Schaller 1998, IUCN 2000b) |
1980 |
250,000 |
(East 1993, IUCN 2000a) |
1992 |
100,000 |
(IUCN 2001) |
1993 |
< 100,000 |
(East 1993) |
1995 |
75,000 |
(Lin et al. 2005) |
1998 |
< 75,000 |
(Schaller 1998) |
1999 |
100,000 – 120,000 |
(Feng 1999) |
2000 |
65,000 – 75,000 |
(IUCN 2000b) |
2001 |
< 75,000 |
(Mallon and Kingswood 2001) |
2003 |
50,000 |
(Kirby 2003) |
2004 |
150,000 |
(Xi and Wang 2004) |
2006 |
120,000 – 150,000 |
(Tinging 2006, Want China Times 2011) |
2008 |
100,000 |
(Leslie and Schaller 2008) |
2009 |
100,000 |
(Larson 2012) |
2011 |
200,000 |
(Antelope Specialist Group 2011) |
Table A2. Data of shahtoosh shawl price (US$) that were adjusted for inflation to the 2006 rate (BLS 2006). For analyses, when value for a specific year varied, we took the mean range value. We used 7 data points that fit with the population size data. The other price records are only here to illustrate the global tendency of Shatoosh shawl price through time and therefore to assess the relative robustness of the 7 data points used in our analyses.
Year |
Shahtoosh shawl price (US$) |
Inflation rate – 2006 (%) |
References |
1950 |
12.15 |
+11.93 |
(IFAW/WTI 2001) |
1970 |
348.12 |
+19.25 |
(Gopinath et al. 2003) |
1980 |
326.62 |
+44.60 |
(Gopinath et al. 2003) |
1995 |
1,435.28 - 1,699.84 |
+32.30 |
(Wright and Kumar 1997) |
1996 |
1,246.35 - 2,203.59 |
+28.50 |
(IFAW/WTI 2001) |
1997 |
1,607.78 - 22,106.92 |
+25.60 |
(IFAW/WTI 2001) |
1999 |
12,100.84 |
+21.00 |
(Nilsson 2005) |
2000 |
4,682.93 |
+17.10 |
(Donn and Yates 2002) |
2001 |
1,138.34 |
+13.80 |
(IFAW/WTI 2001) |
2006 |
1,340 |
|
(Gupta 2011) |
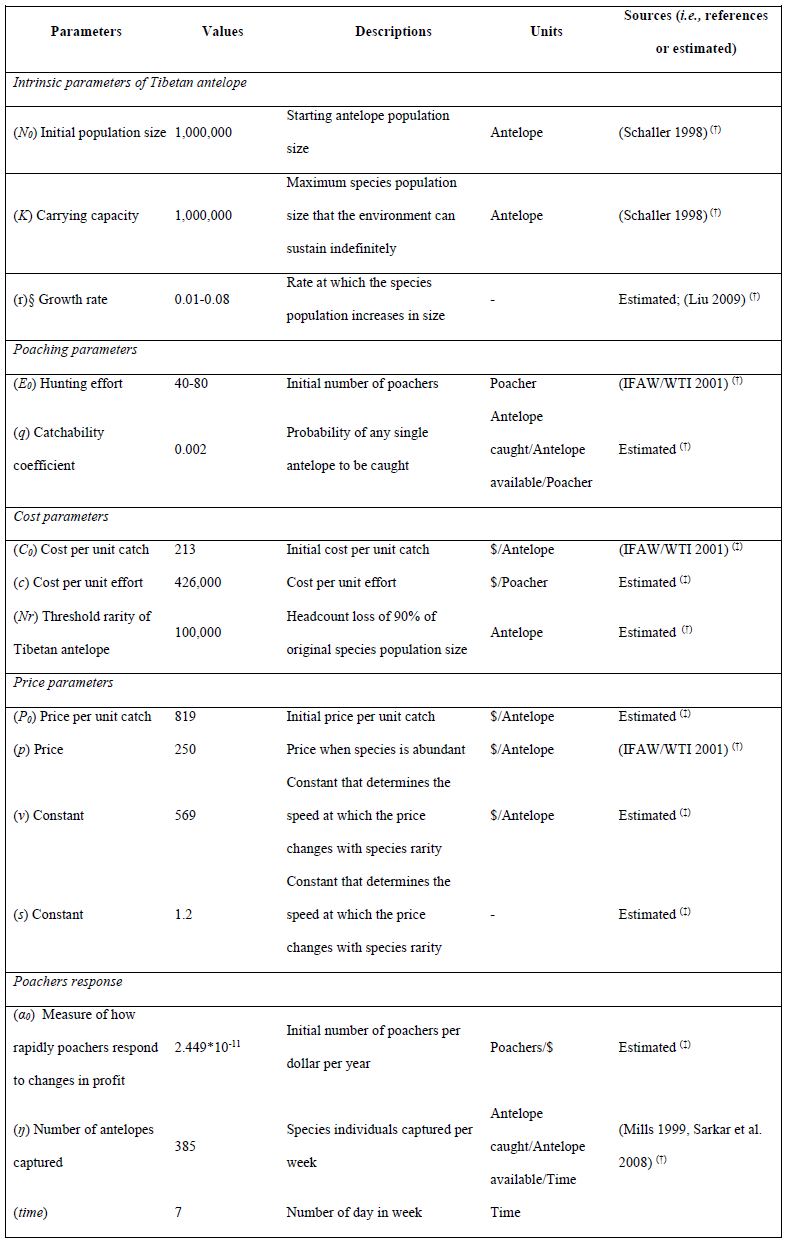
Table A3. Data of intrinsic parameters of Tibetan antelope population dynamics and exploitation parameters.
(†) Parameters were estimated from the literature
(‡) Parameters were calculated
§ The maximum age of antelope is about eight years (Schaller 1998). By assuming constant mortality over years (excluding juveniles mortality), the death rate due to natural mortality would be 1/8 (d). We assumed an unbiased sex-ratio of 0.5, each female giving birth to a single young (Schaller et al. 2006), only 1/3 juveniles between 0 and 1 years old survived (Schaller et al. 2006). We consequently calculated a birth rate of 0.1667 (b). The population annual growth rate was estimated at 0.0417 (r=b-d). However the number of the Tibetan antelope in southwest China's Tibet Autonomous Region increased naturally by 6.6% per year between 1989 and 2005 and by 7.9% between 1999 and 2005 (Liu 2009). Therefore, instead of choosing a fixed value we used an interval value of the growth rate.
Table A4. Sensitivity analysis of the population exploitation models. Percentage of change in the model output following a ± 10% change in any of the input parameters. For abbreviations of the parameters refer to Table A3. Outputs were sensitive to only four parameters (r, K, q and E). Catchability (q) had the largest influence on the model outputs and yet its influence remained relatively low for such model type. For example, a 10% change in catchability resulted in a 26–34% change in the predicted population size by 2000 (variable r and constant E), and a 31–45% change in the predicted population size by 2000 (constant r and variable E). Furthermore, without conservation actions, our model predicted a 99% decline of the antelope population size in 2149 and 2100, depending on the model (Fig. A1a and b, respectively).
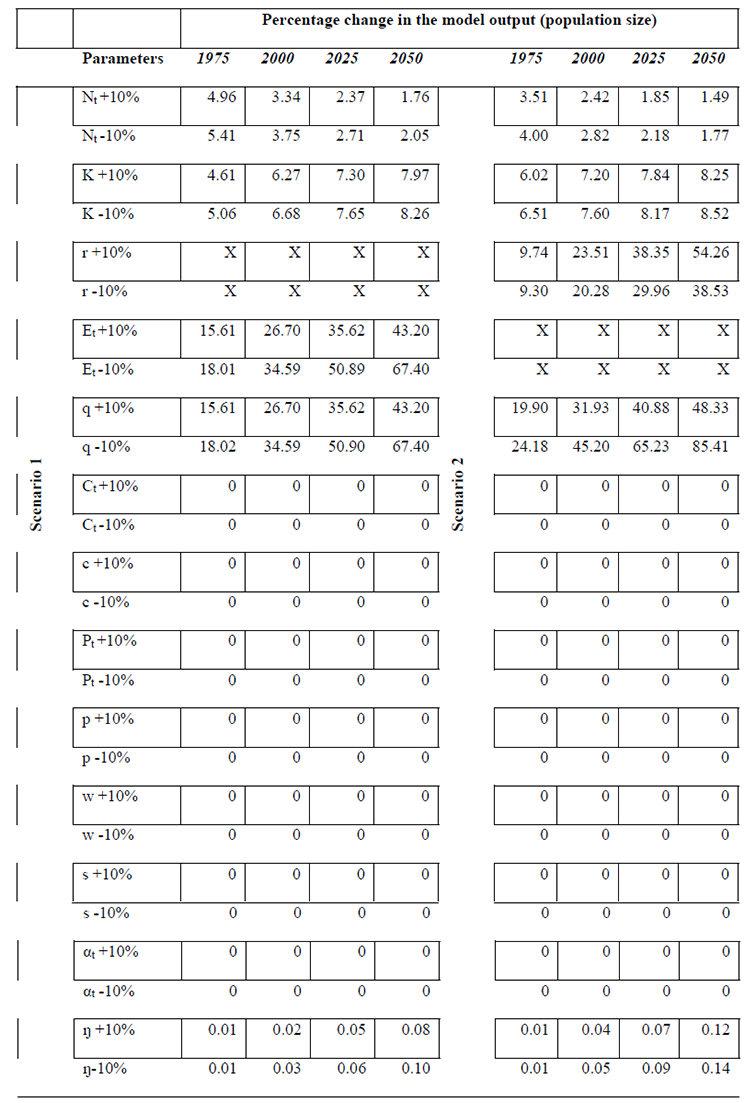
Note: Scenario 1 refers to the Tibetan antelope population dynamics model with a variable growth rate (i.e., 0.01–0.08) and fixed hunting effort (i.e., 40)
Scenario 2 refers to the Tibetan antelope population dynamics model with a fixed growth rate (i.e., 0.08) and variable hunting effort (i.e., 40–80)
Table A5. Result of model fitting for (A) Tibetan antelope population size post-1980 with a fixed growth rate and a variable hunting effort, ranked by model AICc. (B) Tibetan antelope population size post-1992 with a fixed growth rate and a variable hunting effort. We used the data during the period 1980/92–2003 for fitting the models. The best model (in bold) was chosen by using the Akaike Information Criteria corrected for small sample size (AICc). The intercept (X), the slope (Y),the degrees of freedom (d.f.), log likelihood (logLike), ∆AICc and Akaike weight are shown. Hunting threshold is defined as in Table 1.
Model |
Stop-hunting |
X |
Y (slope) |
d.f. |
logLike |
AICc |
∆AICc |
Akaike weight |
(A) Population exploitation models – Post-1980 |
||||||||
AAE model |
|
-6.76e+02 |
0.77 |
7 |
-86.35 |
184.71 |
0 |
0.26 |
No AAE |
1% K |
-8.06e+02 |
0.77 |
7 |
-86.36 |
184.72 |
0.01 |
0.25 |
No AAE |
5% K |
-4.31e+03 |
0.80 |
7 |
-86.50 |
184.99 |
0.28 |
0.23 |
No AAE |
10% K |
-1.16e+05 |
1.63 |
7 |
-86.53 |
185.07 |
0.36 |
0.22 |
No AAE |
20% K |
4.24e+06 |
-20.78 |
7 |
-88.36 |
188.73 |
4.02 |
0.04 |
(B) Population exploitation models – Post-1992 |
||||||||
AAE model |
|
2.75e+03 |
0.99 |
6 |
-76.03 |
166.06 |
0 |
0.36 |
No AAE |
1% K |
2.72e+03 |
0.99 |
6 |
-76.04 |
166.07 |
0.01 |
0.35 |
No AAE |
5% K |
2.66e+03 |
0.99 |
6 |
-76.21 |
166.42 |
0.36 |
0.29 |
Table A6. Results of models fitting for relationship between shahtoosh shawl price (inflation corrected) and Tibetan antelope population size using an exponential and linear relationships. The parameter values given in the equations were estimated by nonlinear regression analysis in R-program using the nls library. The best model (highlighted in bold) was chosen by using the Akaike information criteria for small sample size (AICc). The intercept (d), the slope (e),the degrees of freedom (d.f.), log likelihood (logLike), ∆AICc and Akaike weight are shown.
Model |
d (intercept) |
e |
d.f. |
logLike |
AICc |
∆AICc |
Akaike weight |
Price ~ exp(a + b*Pop size) |
16.44 |
-1.23e-04 |
4 |
-46.64 |
111.27 |
0 |
0.99 |
Price ~ a + b*Pop size |
2151.78 |
-2.42e-03 |
4 |
-51.47 |
120.94 |
9.67 |
0.01 |
(*) The model selection was realized removing the data of extreme price (i.e., 1999)
Table A7. Result of model fitting for Tibetan antelope population size (Equation 1bis) with a fixed growth rate and/or a variable hunting effort, ranked by model AICc. We used the data during the period 1950–2003 to fit the models. The best model (in bold) was chosen by using the Akaike Information Criteria corrected for small sample size (AICc). The intercept (K), the slope (L),the degrees of freedom (d.f.), log likelihood (logLike), ∆AICc and Akaike weight are shown. The equation 1bis was used here.
Model |
K |
L |
d.f. |
logLike |
AICc |
∆AICc |
Akaike weight |
E variable |
2.24e+04 |
0.98 |
8 |
-108.61 |
227.22 |
0 |
0.85 |
r variable |
-1.36e+04 |
1.02 |
8 |
-110.64 |
231.28 |
4.06 |
0.11 |
E & r variable |
6.42e+04 |
0.94 |
8 |
-111.79 |
233.59 |
6.37 |
0.04 |
Table A8. Net present values with discount rate from 3 to 7% of poacher under the four different conservation measures from 2003 to 2050.
|
NPV - 3% discount rate ($) |
NPV - 7% discount rate ($) |
All actions combined |
-47,526 |
-47,780 |
Poacher reconversion |
-52,009 |
-52,276 |
Catchability decrease |
+49,615 |
-11,835 |
Cost per unit effort increase |
+814,815 |
+92,348 |
Table A9. Result of model to test is a change in trend of population size (i.e., from negative to positive) has occurred. In this aim we run glm using percentage of change of population size as the response variable and three potential explanatory factors: years, exploitation phase (i.e., exploitation, conservation) and population size population including interactions among factors.
|
Estimate |
Std. Error |
t value |
Pr(>|t|) |
|
(Intercept) |
2.980e+04 |
1.165e+04 |
2.558 |
0.0377 |
* |
Years |
-7.439e-03 |
2.892e-03 |
-2.572 |
0.0369 |
* |
Exploitation |
-3.274e+04 |
1.174e+04 |
-2.787 |
0.0270 |
* |
Pop_size_observed |
-5.996e-02 |
5.244e-02 |
-1.143 |
0.2904 |
|
years :Exploitation |
8.143e-03 |
2.905e-03 |
2.803 |
0.0264 |
* |
years : Pop_size_observed |
1.531e-08 |
1.299e-08 |
1.179 |
0.2769 |
|
Exploitation : Pop_size_observed |
3.598e-04 |
1.835e-03 |
0.196 |
0.8501 |
|
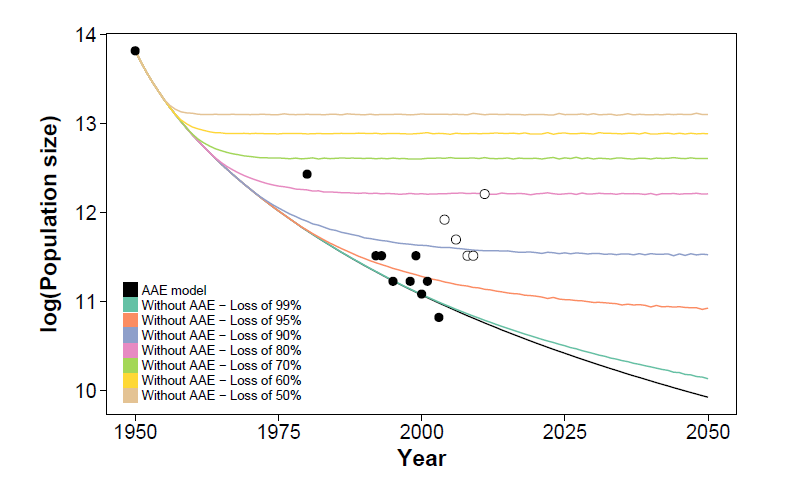
Fig. A1. Logarithm of predicted Tibetan antelope population dynamics with and without an anthropogenic Allee effect between 1950 and 2050. Population dynamics was modeled with a fixed growth rate (i.e., 0.08) and a variable hunting effort (i.e., 40–80). Black line: AAE model (best fit); Different color lines: model that did not take into account an AAE and that assumed that antelope poaching is no longer profitable when the population is reduced to 1%, 5%, 10%, 20%, 30%, 40%, or 50% of the carrying capacity; Closed points represent population size data before the establishment of conservation actions and open symbols represent population size data after the establishment of conservation actions.
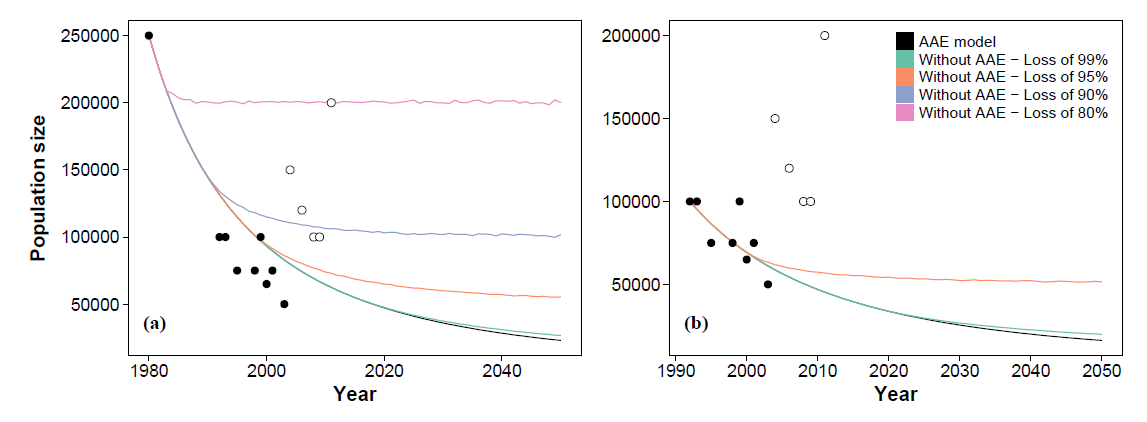
Fig. A2. Predicted models of Tibetan antelope population dynamics with an anthropogenic Allee effect runs from more recent data: 1980 (a) and 1992 (b). Black line: AAE model (best fit); Different color lines: model that did not take into account an AAE and that assumed that antelope poaching is no longer profitable when the population is reduced to 1%, 5%, 10%, 20% of the carrying capacity; Closed points represent population size data before the establishment of conservation actions and open symbols represent population size data after the establishment of conservation actions.
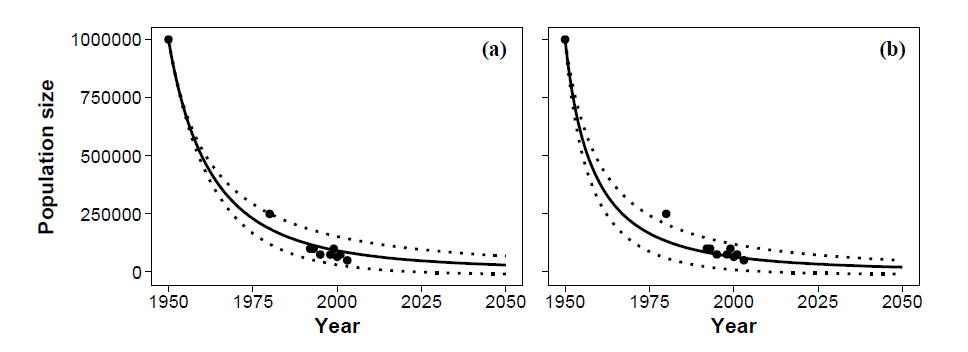
Fig. A3. Predicted Tibetan antelope population dynamics with an anthropogenic Allee effect between 1950 and 2050: (a) with a variable growth rate (i.e., 0.01–0.08) and fixed hunting effort (i.e., 40); (b) with a fixed growth rate (i.e., 0.08) and variable hunting effort (i.e., 40-80). Black line represents the average predicted population size; Dotted line represents the standard deviation of the predicted population size; Points represent population size data before the establishment of conservation actions.
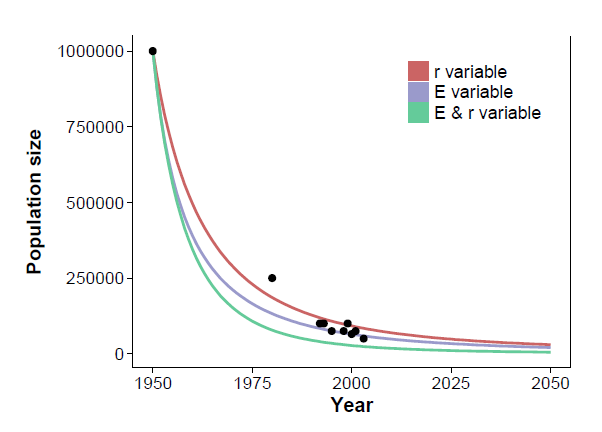
Fig. A4. Predicted Tibetan antelope population dynamics with an anthropogenic Allee effect between 1950 and 2050: with a variable growth rate (i.e., 0.01–0.08) and fixed hunting effort (i.e., 40) (in red); with a fixed growth rate (i.e., 0.08) and variable hunting effort (i.e., 40–80) (in purple); with a variable growth rate (i.e., 0.01–0.08) and variable hunting effort (i.e., 40–80) (in green). Color line represents the average predicted population size; Points represent population size data before the establishment of conservation actions. These predictions did not take conservation actions into account.
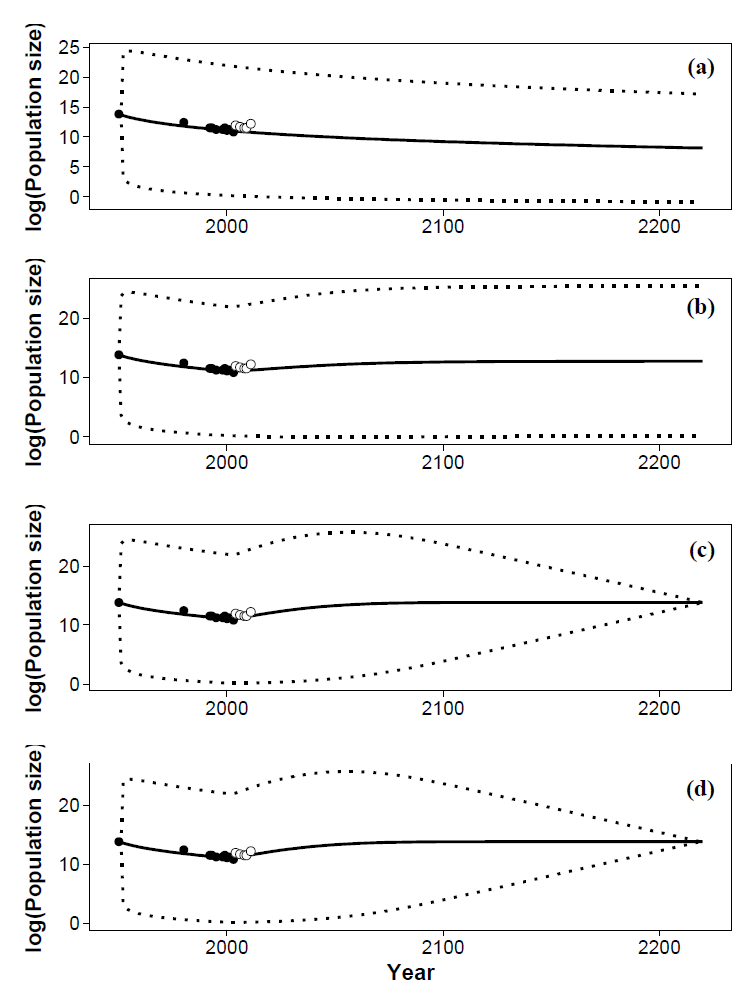
Fig. A5. Logarithm of predicted Tibetan antelope population dynamics after incorporating different conservation actions (from 2003). Conservation actions were: (a) increase of poaching cost; (b) reduction of catchability; (c) decrease of the number of poachers; (d) allthree actions combined. Black line: average predicted population size; Dotted line: standard deviation of the predicted population size; Points: population size data before (black points) and after (white points) the establishment of conservation actions. Population dynamics was modeled with a fixed growth rate (i.e., 0.08) and a variable hunting effort (i.e., 40–80). Closed points represent population size data before the establishment of conservation actions and open symbols represent population size data after the establishment of conservation actions.
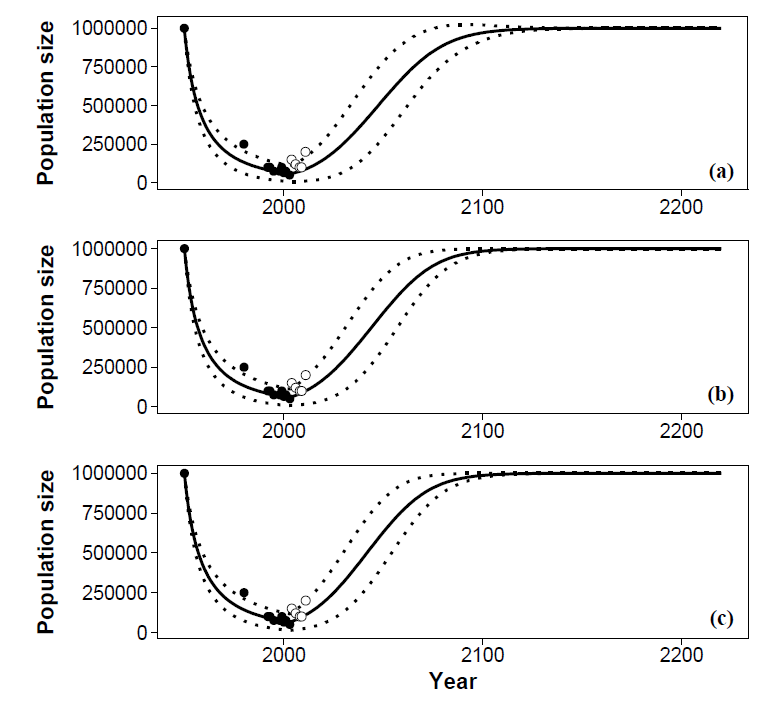
Fig. A6. Predicted Tibetan antelope population dynamics after incorporating different conservation actions (from 2003) with model that did not take into account an AAE and that assumed that antelope poaching is no longer profitable when the population is reduced to 1%. Conservation actions were: (a) reduction of catchability (Eq.7); (b) decrease of the number of poachers (Eq.8); (c) both actions combined. Black line: average predicted population size; Dotted line: standard deviation of the predicted population size; Points: population size data before (black points) and after (white points) the establishment of conservation actions. Population dynamics was modeled with a fixed growth rate (i.e., 0.08) and a variable hunting effort (i.e., 40–80). Closed points represent population size data before the establishment of conservation actions and open symbols represent population size data after the establishment of conservation actions.
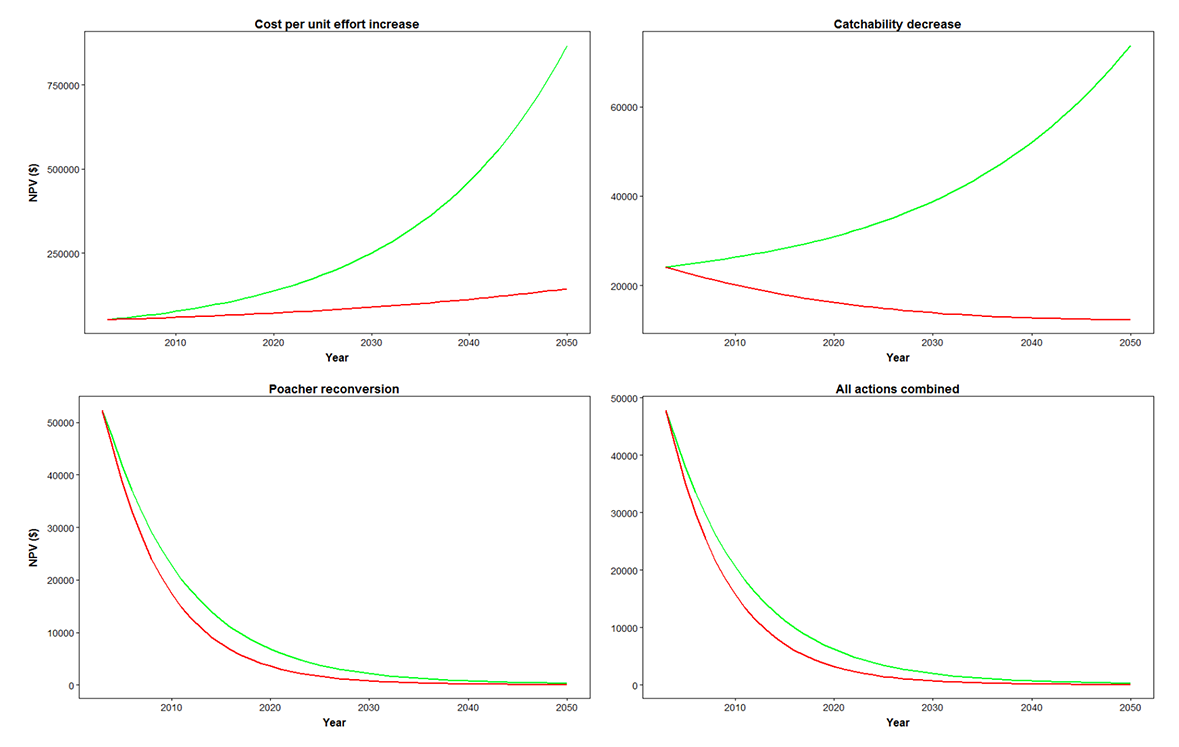
Fig. A7. Net present values of poacher under the four different conservation actions from 2003 to 2050. Conservation actions were: 1. increase of poaching cost per unit effort; 2. reduction of catchability; 3. decrease of the number of poachers; 4. all three actions combined. Green line: NPV with a 3% discount rate; Red line: NPV with a 7% discount rate.
Literature Cited
Antelope Specialist Group. 2011. GNUSLETTER (Vol. 29 No. 2).
BLS. 2006. CPI Inflation Calculator. http://www.bls.gov/data/inflation_calculator.htm
Donn, T., and B. C. Yates. 2002. Identification Guidelines for Shahtoosh and Pashmina. Identification Notes of Wildlife Law Enforcement No. M-02-01. National Fish and Wildlife Forensics Laboratory, Ashland, Oregon, USA.
East, R. 1993. Conservation status of antelopes in Asia and the Middle East, Part 2. Species 20:40–42.
Feng, Z. J. 1999. Status and Conservation of TibetanAntelope (Pantholops hodgsonii) in China. Pages 27-28 in R.D. Zhen editors. The Future of Tibetan Antelope. Proceedings of an International Workshop on Conservation and Control of Trade in Tibetan Antelope, October 12-13, 1999. Beijing, China.
Gopinath, R., R. Ahmed, A. Kumar, and A. Mookerjee. 2003. Beyond the Ban - A Census of Shahtoosh Workers in Jammu & Kashmir. WTI/IFAW, Yarmouth Port, Massachusetts, USA.
Gupta, S. 2011. Contesting Conservation: Shahtoosh Trade and Forest Management in Jammu and Kashmir, India. Dissertation for Ph.D. University of London, London, UK.
IFAW/WTI. 2001. Wrap up the Trade - An International Campaign to Save Endangered Tibetan Antelope. IFAW/WTI, Yarmouth Port, Massachusetts, USA.
IUCN. 2000a. IUCN Red List of Threatened Species. IUCN, Gland, Switzerland.
IUCN. 2000b. IUCN Red List - Species Profiles. IUCN, Gland, Switzerland.
IUCN. 2001. IUCN Red List of Threatened Species. IUCN, Gland, Switzerland and Cambridge, UK.
Kirby, A. 2003. Fears grow for rare antelope. http://news.bbc.co.uk/2/hi/science/nature/2931857.stm
Larson, C. 2012. A model for conservation in China? The Tibetan antelope. http://www.csmonitor.com/World/Asia-Pacific/2012/0828/A-model-for-conservation-in-China-The-Tibetan-antelope
Leslie, D. M. J., and G. B. Schaller. 2008. Pantholops hodgsonii (Artiodactyla: Bovidae). Mammalian Species 817:1–13.
Lin, X., Y. Qisen, W. Yonghua, and L. Yongbo. 2005. Newsletter - An Assessment of the Traffic Disturbance to Tibetan Antelopes in Hoh-Xil National Nature Reserve. Ruffor, Beijing, China.
Mallon, D. P. and S. C. Kingswood. 2001. Antelopes. Part 4: North Africa, the Middle East, and Asia. Global Survey and Regional Action Plans. IUCN, Gland, Switzerland.
Nilsson, G. 2005. Trade: Tibetan Antelope. Pages 1995–1996 in Nilsson, editors. Endangered Species Handbook. Animal Welfare Institute, Washington, USA.
Liu, W. 2009. Tibetan Antelope (ed China Press). China Forestry Press, Beijing, China.
Mills, J. 1999. Tibetan Antelope - Fashion Statement Spells Death for Tibetan Antelope. TRAFFIC East Asia/TRAFFIC India, Hong Kong, Hong Kong and New Delhi, India.
Sarkar, P., J. Takpa, R. Ahmed, S. K. Tiwari, and A. Pendharkar. 2008. Survey of Tibetan Antelope (Pantholops Hodgsonii) and Wild Yak (Bos Grunniens) in Ladakh, Jammu & Kashmir, India. WTI, Uttar Pradesh, India.
Schaller, G. B. 1998. Wildlife of the Tibetan Steppe. University of Chicago Press, Chicago, Illinois, USA.
Schaller, G. B., A. Kang, X. Cai, and Y. Liu. 2006. Migratory and calving behavior of Tibetan antelope population. Acta Theriologica Sinica 26:105–113.
Tinging, Z. 2006. 150,000 Antelopes at Home in Tibet. http://www.china.org.cn/english/zhuanti/zly/174000.htm
Want China Times. 2011. Tibetan Antelope Population Hits 200,000 in Tibet: Researcher. http://www.wantchinatimes.com/news-subclass-cnt.aspx?cid=1105&MainCatID=11&id=20110122000003
Wright, B., and A. Kumar. 1997. Fashioned for Extinction - An Exposé of the Shahtoosh Trade. WPSI, New Delhi, India.
Xi, Z., and L. Wang. 2004. Tracking down Tibetan antelope. Foreign Languages Press, Beijing, China.