Ecological Archives C006-036-A1
Sadie J. Ryan, Tal Ben-Horin, and Leah R. Johnson. 2015. Malaria control and senescence: the importance of accounting for the pace and shape of aging in wild mosquitoes. Ecosphere 6:170. http://dx.doi.org/10.1890/es15-00094.1
Appendix A. A table giving P values of pairwise exact multinomial tests of differences in the physiological age distribution of An. gambiae recorded among monthly house-catches, and figures describing predicted An. gambiae survival at age (Sa), and Scaled individual vectorial capacity (Ci), the shape of ageing, (L/Λ), and age-dependent lab and wild An. gambiae mortality and the age-distribution model estimate, shown for increasing values of EIP (A:10, B:20, C:30 days).
Table A1. P values of pairwise exact multinomial tests of differences in the physiological age distribution of An. gambiae recorded among monthly house-catches at Muheza, from November 1962 to December 1963 (Gillies and Wilkes 1965).
|
Nov 1962 |
Dec 1962 |
Jan 1963 |
Feb 1963 |
Mar 1963 |
Apr 1963 |
May 1963 |
Jun 1963 |
Jul 1963 |
Aug 1963 |
Sept 1963 |
Oct 1963 |
Nov 1963 |
Nov 1962 |
|
|
|
|
|
|
|
|
|
|
|
|
|
Dec 1962 |
0.82 |
|
|
|
|
|
|
|
|
|
|
|
|
Jan 1963 |
0.68 |
0.86 |
|
|
|
|
|
|
|
|
|
|
|
Feb 1963 |
0.90 |
0.82 |
0.72 |
|
|
|
|
|
|
|
|
|
|
Mar 1963 |
0.79 |
0.78 |
0.78 |
0.98 |
|
|
|
|
|
|
|
|
|
Apr 1963 |
0.75 |
0.94 |
0.61 |
0.98 |
0.88 |
|
|
|
|
|
|
|
|
May 1963 |
0.70 |
0.76 |
0.62 |
0.99 |
0.96 |
0.69 |
|
|
|
|
|
|
|
Jun 1963 |
0.72 |
0.86 |
0.72 |
0.82 |
0.52 |
0.56 |
0.66 |
|
|
|
|
|
|
Jul 1963 |
0.81 |
0.85 |
0.98 |
0.85 |
0.76 |
0.39 |
0.77 |
0.90 |
|
|
|
|
|
Aug 1963 |
0.98 |
0.99 |
0.84 |
0.58 |
0.77 |
1.00 |
0.58 |
0.64 |
0.66 |
|
|
|
|
Sept 1963 |
0.60 |
0.23 |
0.30 |
0.75 |
0.36 |
0.35 |
0.29 |
0.56 |
0.46 |
0.61 |
|
|
|
Oct 1963 |
0.81 |
1.00 |
0.84 |
0.98 |
0.60 |
0.95 |
0.66 |
0.93 |
0.63 |
0.91 |
0.77 |
|
|
Nov 1963 |
0.93 |
0.92 |
0.86 |
0.71 |
0.89 |
0.61 |
0.68 |
0.59 |
0.61 |
0.56 |
0.37 |
0.76 |
|
Dec 1963 |
0.98 |
0.95 |
0.92 |
0.62 |
0.69 |
0.82 |
0.59 |
0.62 |
0.59 |
0.63 |
0.30 |
0.96 |
0.91 |
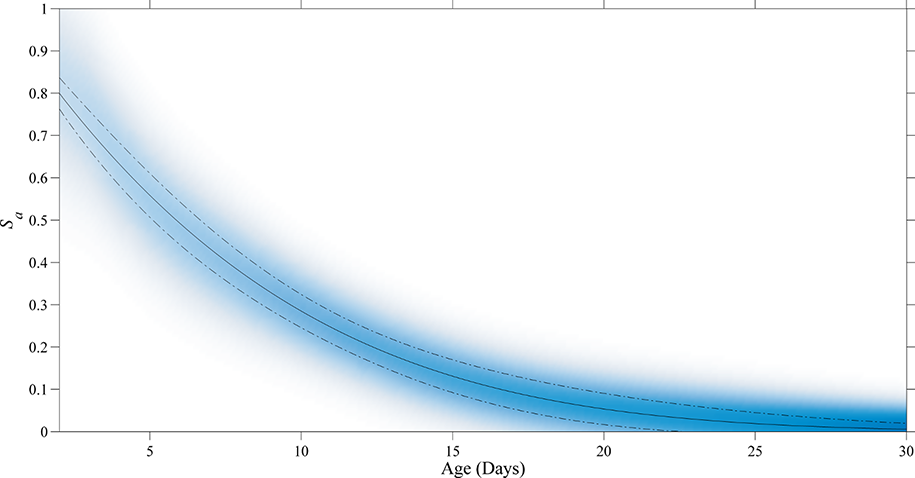
Fig. A1. Predicted An. gambiae survival at age (Sa) at Muheza. The solid line is the predicted mean of the Gompertz mortality model and the dashed lines indicate the 95% confidence interval. The shaded area illustrates Sa as a density strip, where the intensity of shading is proportional to the observed probability density of Sa for all age classes.
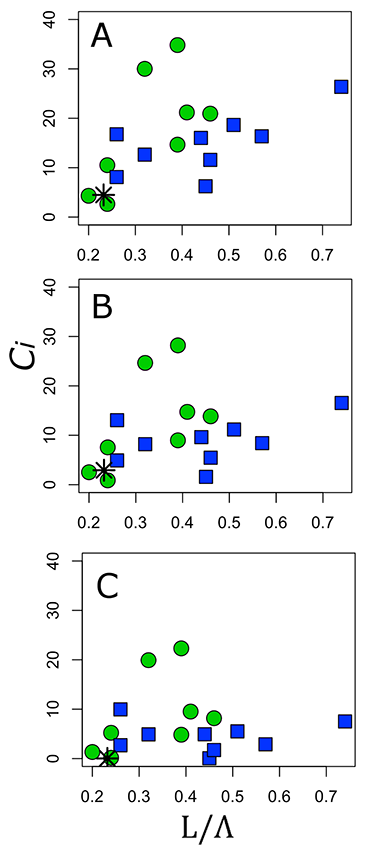
Fig. A2. Scaled individual vectorial capacity (Ci), and the shape of ageing, or magnitude of senescence (L/Λ), and estimated from laboratory (blue squares) and semi-field observations (green circles) of age-dependent An. gambiae mortality (filled points) and the age-distribution model (star). These are again shown for increasing values of EIP (A: 10, B: 20, C: 30 days).
Literature Cited
Gillies, M., and T. Wilkes. 1965. A study of the age-composition of populations of Anopheles gambiae Giles and A. funestus Giles in North-Eastern Tanzania. Bulletin of Entomological Research 56:237–262.