Ecological Archives E096-288-A3
Lauren C. Cline and Donald R. Zak. 2015. Soil microbial communities are shaped by plant-driven changes in resource availability during secondary succession. Ecology 96:33743385. http://dx.doi.org/10.1890/15-0184.1
Appendix C. Supplemental results of microbial community analysis and functional potential, including a summary of pseudo-F values generated from redundancy analysis and distance-based redundancy analysis from redundancy analysis, as well as heat maps illustrating changes in microbial taxonomy and functional potential across the old fields and forests.
Table C1. Summary of pseudo-F values generated from redundancy analysis and distance-based redundancy analysis. Significance indicates the environmental variables that significantly accounted for variation in microbial community composition and functional potential across the old-field chronosequence. Weighted UniFrac distances calculated fungal and bacterial phylogenetic ß-diversity between old fields. Euclidean distances quantified site differences in fungal and bacterial gene assemblages and extracellular enzyme potentials. *** denotes significance at α < 0.001, ** α < 0.01, * α < 0.05, and ° α <0.10.
|
SOM |
Soil pH |
Root Lignin |
C4 grass |
C3 grass |
Fungal phylogenetic β-diversity |
2.96** |
n.s. |
n.s. |
n.s. |
n.s. |
Bacterial phylogenetic β-diversity |
n.s. |
1.94* |
n.s. |
n.s. |
n.s. |
Fungal genetic potential |
n.s. |
n.s. |
n.s. |
3.65* |
2.38* |
Bacteria genetic potential |
4.10° |
n.s. |
n.s. |
n.s. |
n.s. |
Enzyme potential |
13.7*** |
n.s. |
n.s. |
6.95* |
n.s. |
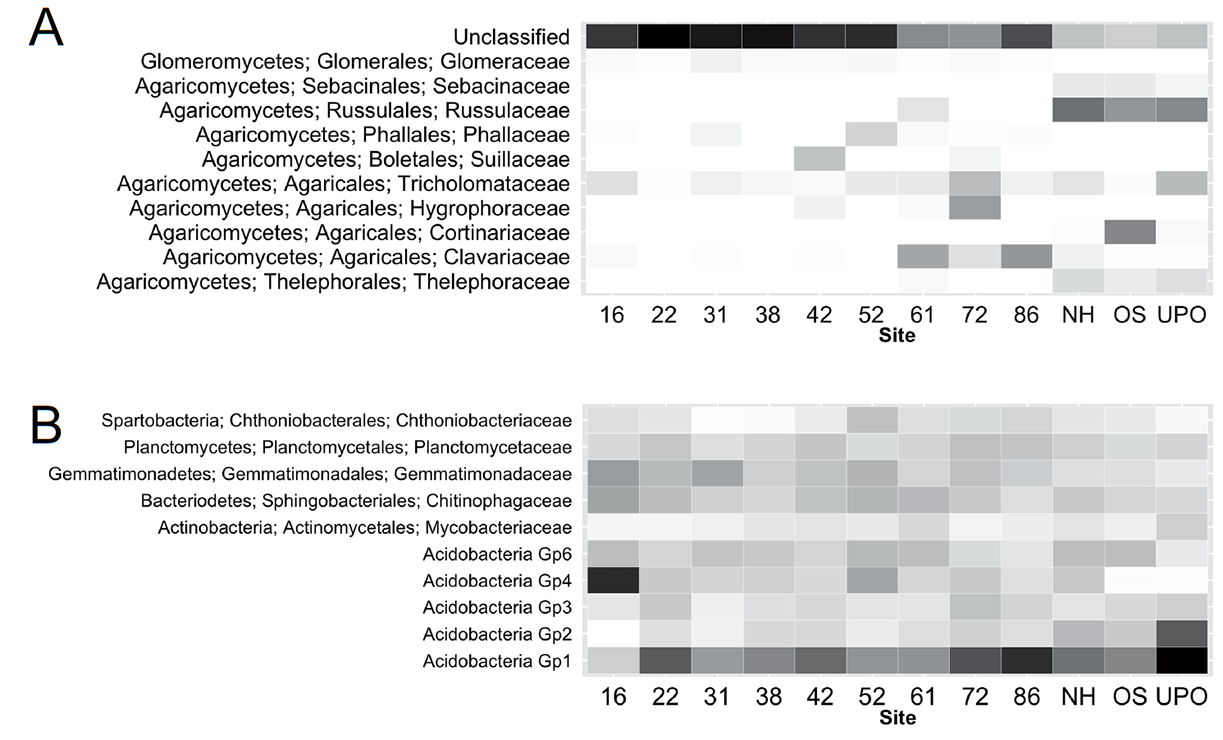
Fig. C1. Changes in the relative abundance of the ten most abundant fungal (A) and bacterial (B) families across the old-field chronosequence and late-successional forests. Numbers represent old fields by time (yrs) since agricultural abandonment. Letters represent the three forested sites (NH = Northern Hardwoods, OS = Oak Savanna and UPO = Upland Pin Oak). Light shades represent low relative abundance of microbial taxa and darker shades of gray to black higher relative abundance.
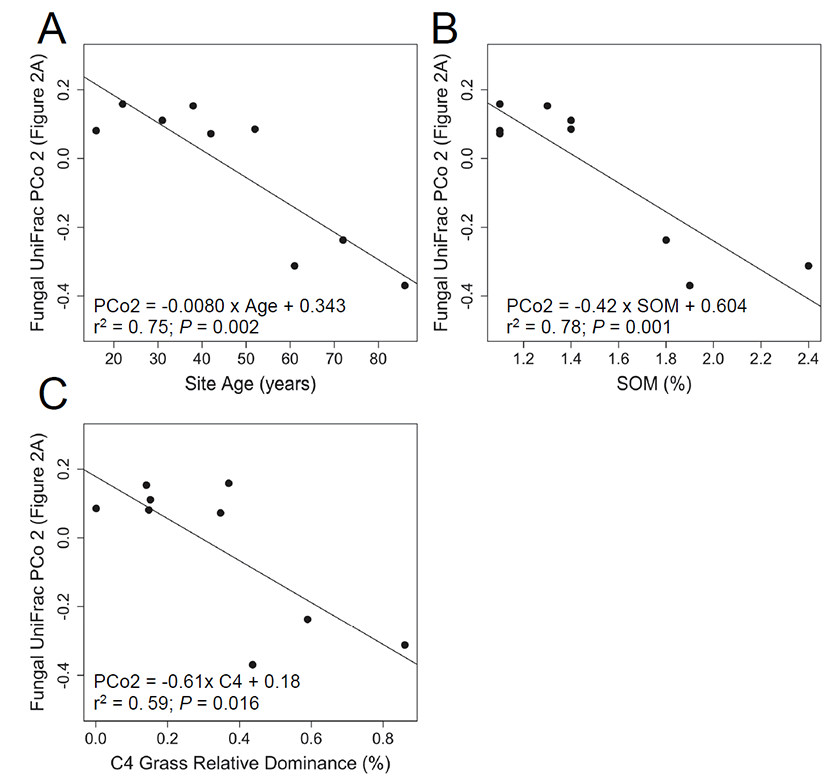
Fig. C2. Variation in old-field fungal phylogenetic composition (UniFrac), captured by principal coordinates analysis (PCo 2 of Fig. 2A), is significantly correlate to site age (A), soil organic matter content (B) and C4 grass relative dominance (C) across the old-field chronosequence.
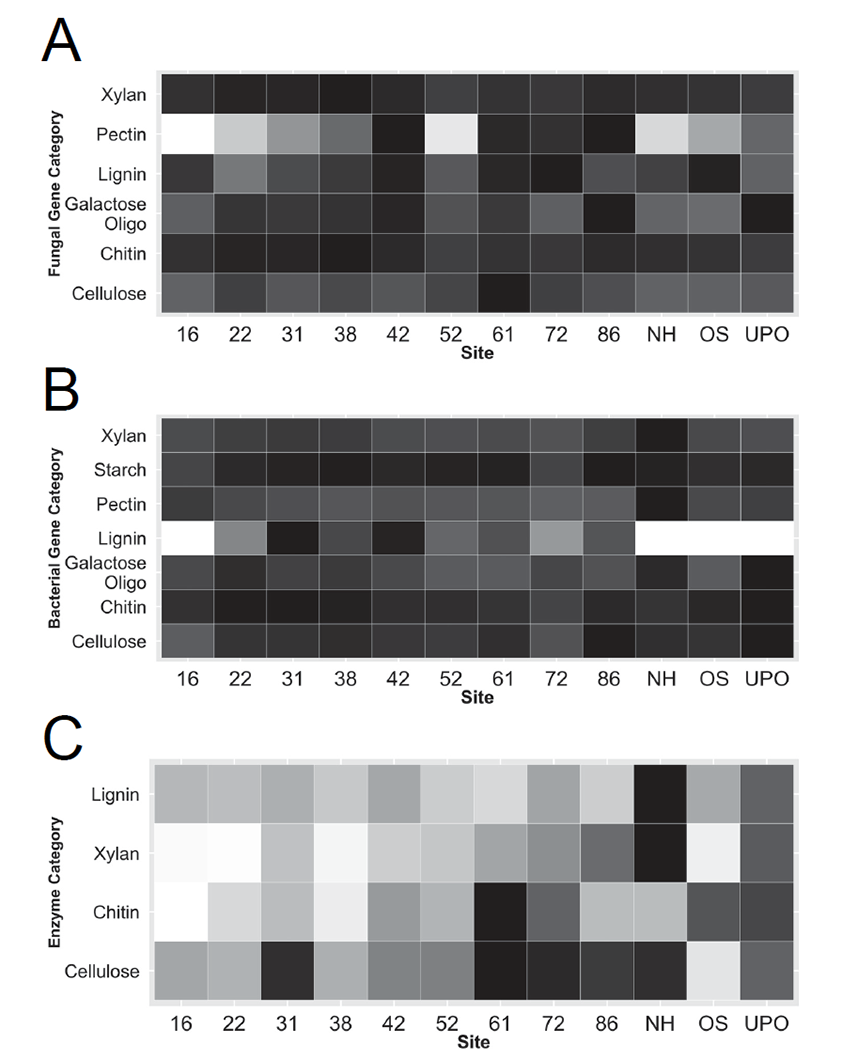
Fig. C3. Changes in the functional potential of soil microbial community to degrade components of dead organic material across the old-field chronosequence and late successional ecosystems according to three different measures, relative abundance of fungal genes (A), relative abundance of bacterial genes (B), and enzyme activity (C). Numbers represent old fields by time (yrs) since agricultural abandonment. Letters represent the forested sites (NH = Northern Hardwoods, OS = Oak Savanna and UPO = Upland Pin Oak). Light shades represent low relative abundance of microbial taxa and darker shades of gray represent higher relative abundance. Relative abundance of substrate categories were expressed as proportion of sequences with predicted functions. For visualization in heatmap, each substrate category was standardized relative to its maximum observed value to downweight substrate categories with magnitudinally higher relative abundances. Enzyme activities were expressed as mmol·h-1·g-1 and square root transformed to downweight abundant gene and enzyme categories.