Ecological Archives E096-288-A2
Lauren C. Cline and Donald R. Zak. 2015. Soil microbial communities are shaped by plant-driven changes in resource availability during secondary succession. Ecology 96:33743385. http://dx.doi.org/10.1890/15-0184.1
Appendix B. Supplemental study site information, including environmental characteristics and plant species lists of old fields and forests.
Table B1. Soil, root, and plant functional characteristics collected for each of the nine sites in the old-field chronosequence and three forests (NH = northern hardwoods, OS = oak savanna, UPO = upland pin oak). Plant biomass was not collected for forest communities.
Site Age (y) |
16 |
22 |
31 |
38 |
42 |
52 |
61 |
72 |
86 |
NH |
OS |
UPO |
|
Soil Characteristics |
|||||||||||||
pH |
6.4 |
5.8 |
5.7 |
5.4 |
5.9 |
5.9 |
6 |
5.6 |
5.7 |
5.2 |
5.8 |
5 |
|
SOM (mg/g) |
11 |
11 |
14 |
13 |
11 |
14 |
24 |
18 |
19 |
40 |
33 |
27 |
|
Total N (mg/g) |
859 |
821 |
1063 |
946 |
868 |
1139 |
1274 |
1132 |
1220 |
1902 |
1942 |
1262 |
|
Root Characteristics |
|||||||||||||
Lignin (mg/g) |
66 |
7.0 |
72 |
35 |
131 |
87 |
161 |
74 |
101 |
289 |
333 |
318 |
|
|
Cellulose (mg/g) |
692 |
623 |
657 |
837 |
454 |
314 |
385 |
719 |
624 |
433 |
272 |
364 |
|
|
Hemicellulose (mg/g) |
74 |
147 |
115 |
57 |
185 |
363 |
254 |
100 |
64 |
36 |
94 |
23 |
|
Lignin:N |
10.7 |
11.4 |
14.0 |
10.5 |
14.8 |
9.0 |
27.3 |
14.7 |
12.7 |
38.7 |
29.1 |
24.6 |
|
Plant Characteristics (% Relative Dominance) |
|||||||||||||
C3 grass |
74.0 |
38.1 |
83.5 |
46.0 |
42.8 |
90.0 |
7.4 |
26.0 |
31.8 |
|
|
|
|
C4 grass |
14.8 |
37.0 |
15.2 |
14.1 |
34.7 |
0.1 |
86.0 |
59.0 |
43.7 |
|
|
|
|
Forb |
5.7 |
18.2 |
0.1 |
14.0 |
22.1 |
6.9 |
2.1 |
0.1 |
4.2 |
|
|
|
|
Legume |
5.5 |
2.2 |
1.1 |
25.5 |
0.3 |
0.0 |
0.0 |
0.0 |
0.0 |
|
|
|
|
Table B2. List of C3 grass and C4 grass species present in each old-field. Plant species are ordered with decreasing plant dominance, calculated as proportion of total plant litter biomass collected at each site. Grass species representing < 0.01 of total biomass were not included.
|
C3 Grasses |
C4 Grasses |
||
Site Age (y) |
Grass Species |
Relative Dominance |
Grass Species |
Relative Dominance |
16 |
Poa pratensis |
0.33 |
Leptoloma cognatum |
0.14 |
Agropyron repens |
0.32 |
|
||
Agrostis scabra |
0.09 |
|
|
|
22 |
Poa pratensis |
0.36 |
Leptoloma cognatum |
0.37 |
Agrostis scabra |
0.01 |
|
||
Agropyron repens |
0.01 |
|
|
|
31 |
Poa pratensis |
0.43 |
Leptoloma cognatum |
0.15 |
Bromus inermis |
0.34 |
|
||
Agropyron repens |
0.07 |
|
|
|
38 |
Poa pratensis |
0.43 |
Leptoloma cognatum |
0.14 |
Panicum perlongum |
0.03 |
|
|
|
42 |
Poa pratensis |
0.37 |
Schizachyrium scoparium |
0.35 |
Agropyron repens |
0.06 |
|
|
|
52 |
Agropyron repens |
0.46 |
|
|
Poa pratensis |
0.44 |
|
|
|
61 |
Poa pratensis |
0.06 |
Andropogon gerardi |
0.78 |
Stipa spartea |
0.01 |
Sorghastrum nutans |
0.07 |
|
|
|
Schizachyrium scoparium |
0.01 |
|
72 |
Poa pratensis |
0.22 |
Andropogon gerardi |
0.31 |
Agropyron repens |
0.04 |
Schizachyrium scoparium |
0.26 |
|
|
|
Sorghastrum nutans |
0.02 |
|
86 |
Stipa spartea |
0.12 |
Andropogon gerardi |
0.38 |
Poa pratensis |
0.10 |
Leptoloma cognatum |
0.03 |
|
Panicum praecocious |
0.08 |
Sorghastrum nutans |
0.02 |
|
Panicum perlongum |
0.02 |
|
|
|
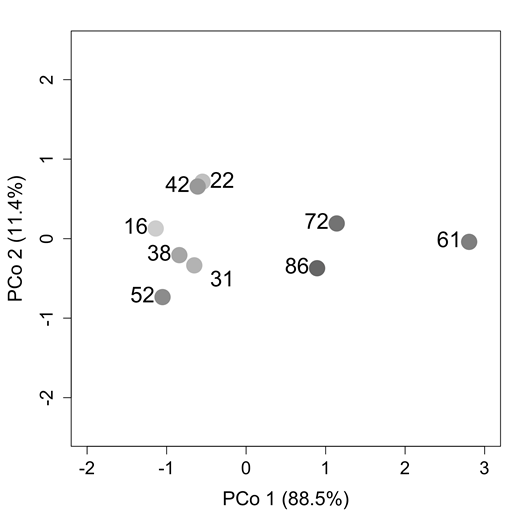
Fig. B1. Principal coordinates analysis of old field environmental characteristics, by considering variation in old-field soil organic matter content and C4 grass relative dominance. Environmental characteristics were z-transformed and the Euclidean distance metric was used to calculate pairwise differences in site characteristics. Numbers indicate old-field age and shading represents a gradient of old-field age with young fields in light gray and older fields in dark gray.