Ecological Archives E096-284-A1
Daniel Z. Atwater and Ragan M. Callaway. 2015. Testing the mechanisms of diversity-dependent overyielding in a grass species. Ecology 96:33323342. http://dx.doi.org/10.1890/15-0889.1
Appendix A. Tables containing results of PCA on climate data and analyses of treatment on plant and soil nutrients, and figures showing comparison of actual and predicted monoculture yield and ΔRY, and effects of monoculture yield and home climate on per-capita biomass.
Table A1. Results of unrotated principal components analysis of climate data. Loadings of each variable on the first (Temp.) and second (Precip.) principal components are shown.
|
Temp. |
Precip. |
Mean annual temperature |
0.98 |
|
Mean warmest mo. temp. |
0.91 |
|
Mean coldest mo. temp. |
0.72 |
|
Mean annual precipitation |
-0.87 |
|
Mean summer precipitation |
-0.59 |
-0.66 |
Mean ann. heat:moisture ind. |
0.63 |
0.66 |
Mean summ. heat:moist. ind. |
0.82 |
|
Degree days below 0° |
-0.76 |
|
Degree days above 5° |
0.98 |
|
Degree days below 18° |
-0.80 |
|
Degree days above 18° |
0.94 |
|
Total frost-free days per year |
0.90 |
|
Beginning of frost-free period |
-0.89 |
|
End of frost-free period |
0.88 |
|
Days in frost-free period |
0.90 |
|
Prop. precipitation as snow |
-0.77 |
|
Extreme 30 day temp. min. |
0.76 |
|
Hargreaves evaporation |
0.76 |
|
Hargreaves clim. moist. def. |
0.58 |
0.77 |
Table A2. Correlations between overyielding components and soil nutrients. * P ≤ 0.05, ** P ≤ 0.01, a P = 0.065.
|
Actual |
|
Adjusted |
|
|
||||||
|
SIE |
SDDE |
SDCE |
Net |
|
SIE |
SDDE |
SDCE |
Net |
|
Yield |
Soil Ammonium Conc. |
n.s |
n.s |
n.s |
n.s |
n.s |
n.s |
n.s |
n.s |
n.s |
||
Soil Nitrate Conc. |
0.376* |
n.s |
n.s |
0.345* |
0.342* |
n.s |
n.s |
0.345** |
n.s |
||
Plant N Conc. |
n.s |
n.s |
n.s |
-0.346* |
|
n.s |
n.s |
n.s |
-0.316a |
|
n.s |
Table A3. Results of MANOVA analysis and component univariate analyses of the effects of fungicide and richness treatments on soil and plant nutrient concentrations.
|
|
MANOVA |
|
Soil NH4+ |
|
Soil NO3- |
|
Plant [N] |
||||
|
df |
F (Pillai) |
P |
|
F |
P |
|
F |
P |
|
F |
P |
Fungicide |
1 |
0.102 |
0.958 |
0.036 |
0.850 |
0.325 |
0.573 |
0.015 |
0.905 |
|||
Richness |
2 |
1.217 |
0.311 |
1.019 |
0.373 |
1.619 |
0.216 |
0.700 |
0.504 |
|||
Fung. × Rich. |
2 |
0.569 |
0.753 |
1.242 |
0.304 |
0.430 |
0.655 |
0.538 |
0.590 |
|||
Error |
29 |
|
|
|
|
|
|
|
|
|
|
|
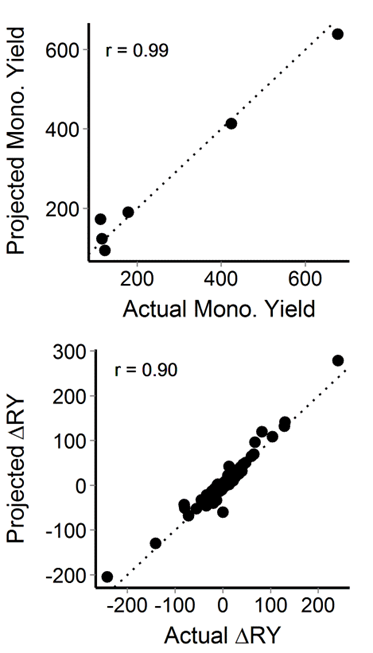
Fig. A1. Comparison of predicted and estimated monoculture yield and relative overyielding (∆RY) for accessions with known monoculture yields. The Pearson correlation coefficient (r) is also shown.
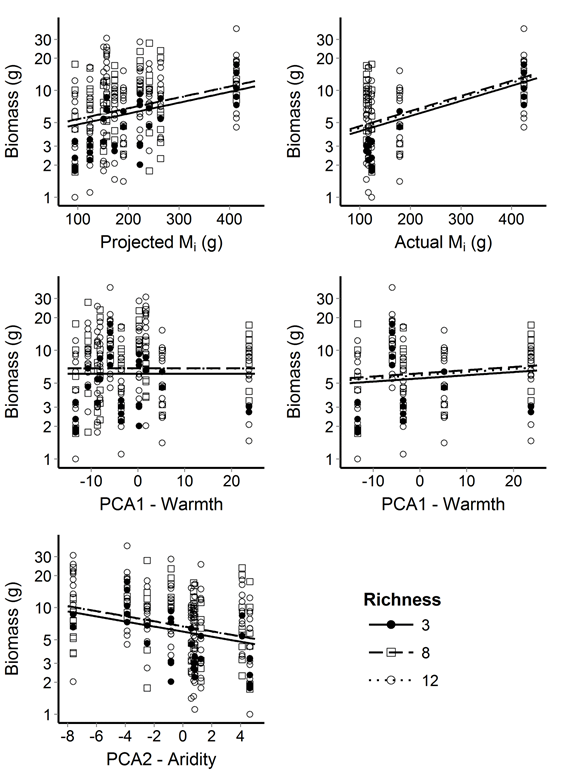
Fig. A2. Effects of home climate temperature (PCA1), home climate aridity (PCA2), and monoculture yield (Mi) on per plant average dry aboveground biomass. Points show average per-plant biomass of each accession in each plot, with shape indicating plot richness (filled circles: 3 accessions; open squares: 8 accessions; open circles: 12 accessions) Lines show linear relationships between predictor and response variables, estimated by full model averaging, with line type indicating plot richness (solid: 3 accessions; dashed: 8 accessions; dotted: 12 accessions). The left column shows models fitted to all accessions, the right shows models fitted only to accessions with measured monoculture yields.