Ecological Archives E096-280-A2
Timothy D. Jardine, Ryan Woods, Jonathan Marshall, James Fawcett, Jaye Lobegeiger, Dominic Valdez, and Martin J. Kainz. 2015. Reconciling the role of organic matter pathways in aquatic food webs by measuring multiple tracers in individuals. Ecology 96:32573269. http://dx.doi.org/10.1890/14-2153.1
Appendix B. Detailed isotope mixing model outputs and tabulated fatty acid profiles for sources and consumers.
B.1 SIAR outputs
Dietary source proportions, averaged across all sites and times, were highly variable among insects, crustaceans, mollusks and turtles (Table B1). For fishes, large sample sizes within each site and time allowed calculation of source proportions at most sites and times, and there was limited variation within taxa by location or sample period (Table B2). For carp, the median contribution of C4 detritus was >36%, with a maximum of 53%, and the lower values were typically offset by increases in the C3 detrital pathway, such that the range of total terrestrial contribution across sites was only 11% for this species (min = 57%, max = 68%). Likewise, golden perch C4 contribution ranged from 32 to 52% across sites, while the plankton contribution ranged from 19 to 35%. The planktonic pathway was always the dominant source for small bony bream, with a minimum contribution of 34% and a maximum of 78%, while large bony bream used a more balanced mix of sources (Table B2).
B.2 Fatty acid biomarkers
In addition to physiologically-active PUFA and their pre-cursors, we also examined potential source-specific FA biomarkers. While it is biochemically recognized that long-chain SAFA, such as 22:0 and longer, are abundant in terrestrial organic matter (Table B4), these FA are poorly retained in consumers (Fig. 2; see also Kainz et al. 2002). Consistent with other reports that used oleic acid (18:1w9) in consumers as a marker for terrestrial organic matter (e.g. Hebert et al. 2008, Lau et al. 2012, 2013), we identified relatively high 18:1w9 in terrestrial insects, but less in zooplankton (Table B5). Ratios of 16:1w7, a marker for epilithic diatoms (Napolitano 1999, Suschik et al. 2010) to 18:1w9 were <1 in invertebrates with the exception of known grazers, the mayflies Baetidae and Caenidae (Table B5). Ratios were also <1 for all fishes, with only small bony bream (<100mm) exhibiting values that approached 1 (Table B6). While epipelon and epixylon had higher 16:1w7 than 18:1w9, ratios of these two biomarkers were lower (~2:1, Table B4) compared with those reported by Suschik et al. (2010) for the diatom dominated assemblage (~4:1). We suggest that the ratio of these two FA, and 18:1w9 in particular, may provide a robust indicator of aquatic vs. terrestrial resource use in situations where isotopic differentiation between sources is limited (Jardine et al. 2008). As examples, Lau et al. (2012) reported 16:1w7 to 18:1w9 ratios >1 in Ephemeroptera, but <1 in all other insect taxa in oligotrophic Swedish lakes, while Goedkoop et al. (2000) reported ratios ≥1 for all taxa in a large mesotrophic lake where terrestrial inputs were limited. In our data set, 18:1w9 significantly declined with decreasing proportion aquatic diet for all taxa (herbivorous insects, r² = 0.17, F1,44 = 9.043, p = 0.004; predatory insects, r² = 0.33, F1,32 = 15.463, p < 0.001; prawns, r² = 0.27, F1,28 = 10.333, p = 0.003, fishes, r² = 0.28, F1,128 = 49.455, p < 0.001).
B.3 Fatty acids and dietary source proportions
Herbivorous and predatory insects exhibited similar patterns when comparing w3 PUFA with aquatic resource use. Both groups showed significant associations between EPA and the proportion of the diet that was aquatic (herbivores: r² = 0.10, F1,44 = 4.85, p = 0.033; predators: r² = 0.28, F1,32 = 13.01, p = 0.001, Fig. 3A, Table B7). However, ALA was not significantly higher in individuals with a diet that was derived from the aquatic pathway (herbivores: r² = 0.02, F1,44 = 0.65, p = 0.423; predators: r² = 0.05, F1,32 = 1.88, p = 0.179), while the DHA vs. % aquatic relationship was not significant for herbivores (r² = 0.01, F1,44 = 0.23, p = 0.631), but significant for predators (r² = 0.17, F1,32 = 6.72, p = 0.014) (Fig. 3A, Table B7).
Like insects, crustaceans had higher EPA than DHA, and were similar to predatory insects in their response for w3 PUFA. Prawns had higher ALA (r² = 0.30, F1,28 = 12.18, p = 0.002) and DHA (r² = 0.23, F1,28 = 8.78, p = 0.006, Fig. 3D) but not EPA (r² = 0.02, F1,28 = 0.67, p = 0.419), when the aquatic diet contribution was high. Data for crayfish were consistent with those of prawns (Fig. 3D), but were not tested separately because of small sample sizes.
For fish, all three w3 PUFA were significantly higher when the contribution from aquatic sources was high (ALA, r² = 0.22, F1,128 = 35.27, p < 0.001; EPA, r² = 0.32, F1,128 = 59.14, p < 0.001; DHA, r² = 0.12, F1,128 = 17.01, p < 0.001, Fig. 3G). This grouping of fishes in a single regression masks a gradient from carp that had low relative aquatic contribution and low w3 PUFA, to bony bream that had a high relative aquatic and w3 PUFA contribution.
Taxa varied in the relationship between dietary patterns and w6 PUFA. Herbivorous insects did not have significantly lower LIN or ARA when feeding on the aquatic source pathway (p > 0.05, Fig. 3B) and predators had lower LIN (r² = 0.15, F1,32 = 6.03, p = 0.020) but no difference in ARA (p > 0.05) when aquatic diet contribution was high (Fig. 3B). Prawns showed no significant relationship between LIN and aquatic diet contribution (r² = 0.11, F1,28 = 3.50, p = 0.071), but ARA was lower at high aquatic diet contribution (r² = 0.25, F1,28 = 9.88, p = 0.004, Fig. 3E). By contrast, LIN was significantly lower in fish when % aquatic was high (r² = 0.31, F1,128 = 58.43, p < 0.001, Fig. 3H), whereas ARA showed no change (r² < 0.01, F1,128 = 0.41, p = 0.525).
Table B1. SIAR posterior distributions (median and upper and lower 95% credible interval) for insects, mollusks, crustaceans and reptiles in waterholes of the Border Rivers system, southwestern Queensland, Australia.
Dietary source proportions (%) |
|||||||
Taxon |
n |
Plankton |
Periphyton |
C3 detritus |
C4 detritus |
||
Herbivorous aquatic insects |
|||||||
Ephemeroptera |
13 |
64 (49–75) |
6 (0–25) |
7 (0–27) |
20 (12–28) |
||
Chironomidae |
8 |
51 (30–64) |
7 (0–28) |
9 (0–37) |
30 (21–39) |
||
Corixidae |
15 |
32 (2–49) |
8 (0–55) |
12 (0–58) |
40 (29–48) |
||
Trichoptera |
8 |
68 (60–76) |
1 (0–7) |
1 (0–7) |
28 (21–35) |
||
Coleoptera |
10 |
6 (0–26) |
33 (2–59) |
16 (1–49) |
42 (33–52) |
||
Predatory aquatic insects |
|||||||
Dytiscidae |
6 |
7 (0–31) |
31 (1–63) |
20 (1–54) |
38 (27–50) |
||
Gerridae |
11 |
36 (20–50) |
10 (1–30) |
13 (1–36) |
39 (32–46) |
||
Notonectidae |
10 |
50 (2–64) |
7 (0–80) |
6 (0–68) |
31 (10–40) |
||
Odonata |
14 |
64 (55–72) |
3 (0–13) |
3 (0–14) |
27 (21–34) |
||
Terrestrial insects |
|||||||
Formicidae |
15 |
17 (2–34) |
15 (1–42) |
13 (1–40) |
51 (43–58) |
||
Orthoptera |
20 |
4 (0–18) |
18 (1–41) |
12 (0–34) |
62 (35–55) |
||
Crustaceans |
|||||||
Macrobrachium australiense |
208 |
58 (56–59) |
0 (0–0) |
0 (0–1) |
42 (40–43) |
||
Cherax spp. |
14 |
47 (34–57) |
5 (0–19) |
6 (0–24) |
39 (33–46) |
||
Mollusks |
|||||||
Hyriidae |
15 |
72 (63–80) |
3 (0–13) |
4 (0–15) |
19 (12–26) |
||
Reptiles |
|||||||
Chelodina longicollis |
11 |
20 (4–36) |
15 (1–39) |
15 (1–39) |
48 (40–56) |
||
Table B2. Variation in space (5 waterholes) and time (3 sampling events) in fish catch and estimates of dietary source proportions as calculated with stable C and N isotopes and SIAR.
Dietary source proportions (%) |
||||||||
Site |
Month |
Spp. |
Biomass in catch (g) |
Site total (%) |
Plankton |
Periphyton |
C3 detritus |
C4 detritus |
Booligar |
June |
N. erebi (small) |
254 |
2 |
34 (18–50) |
23 (3–43) |
24 (3–44) |
19 (11–28) |
N. erebi (large) |
907 |
6 |
14 (1–34) |
30 (4–58) |
29 (3–53) |
27 (18–36) |
||
C. carpio |
10760 |
71 |
14 (1–37) |
21 (1–48) |
19 (1–45) |
43 (31–56) |
||
N. hyrtlii |
2680 |
18 |
N/A |
N/A |
N/A |
N/A |
||
L. unicolor |
579 |
4 |
N/A |
N/A |
N/A |
N/A |
||
August |
C. carpio |
108599 |
97 |
13 (1–34) |
18 (1–45) |
15 (1–41) |
50 (38–64) |
|
C. auratus |
2025 |
2 |
N/A |
N/A |
N/A |
N/A |
||
M. ambigua |
1009 |
1 |
29 (8–46) |
13 (1–37) |
16 (1–42) |
40 (30–50) |
||
November |
N. erebi (small) |
16 |
0 |
N/A |
N/A |
N/A |
N/A |
|
N. erebi (large) |
726 |
1 |
41 (27–55) |
13 (1–35) |
16 (1–39) |
28 (21–35) |
||
C. carpio |
54149 |
97 |
12 (1–27) |
23 (2–46) |
13 (1–37) |
50 (43–58) |
||
C. auratus |
692 |
1 |
27 (5–47) |
21 (2–45) |
21 (2–46) |
30 (19–42) |
||
Gidi Gidi |
June |
N. erebi (small) |
6 |
0 |
47 (28–69) |
20 (1–45) |
27 (3–54) |
4 (0–13) |
N. erebi (large) |
887 |
13 |
40 (23–56) |
27 (4–50) |
25 (3–48) |
8 (1–16) |
||
C. carpio |
3915 |
56 |
13 (1–34) |
16 (1–43) |
14 (1–40) |
53 (41–67) |
||
C. auratus |
408 |
6 |
N/A |
N/A |
N/A |
N/A |
||
M. ambigua |
1780 |
25 |
21 (2–41) |
21 (2–45) |
20 (1–44) |
37 (26–49) |
||
August |
N. erebi (small) |
2 |
0 |
N/A |
N/A |
N/A |
N/A |
|
N. erebi (large) |
2167 |
51 |
37 (25–50) |
26 (7–43) |
26 (7–43) |
12 (5–18) |
||
C. carpio |
364 |
9 |
16 (1–40) |
21 (1–48) |
18 (1–45) |
41 (28–56) |
||
C. auratus |
505 |
12 |
N/A |
N/A |
N/A |
N/A |
||
M. ambigua |
1210 |
28 |
24 (8–39) |
21 (3–40) |
20 (2–40) |
35 (28–43) |
||
November |
C. carpio |
7169 |
41 |
17 (3–31) |
22 (3–41) |
16 (1–38) |
44 (37–51) |
|
C. auratus |
1514 |
9 |
29 (7–47) |
24 (2–47) |
24 (2–47) |
25 (13–36) |
||
L. unicolor |
195 |
1 |
30 (5–52) |
16 (1–44) |
20 (1–48) |
32 (18–46) |
||
M. ambigua |
7169 |
41 |
28 (14–41) |
18 (2–36) |
17 (2–36) |
36 (30–43) |
||
T. tandanus |
1422 |
8 |
N/A |
N/A |
N/A |
N/A |
||
St George |
June |
N. erebi (small) |
187 |
1 |
43 (10–70) |
15 (1–49) |
22 (1–61) |
15 (2–31) |
N. erebi (large) |
1619 |
8 |
34 (6–53) |
32 (2–67) |
17 (1–56) |
15 (5–24) |
||
C. carpio |
11275 |
53 |
22 (2–42) |
18 (1–44) |
17 (1–45) |
40 (29–53) |
||
N. hyrtlii |
4413 |
21 |
N/A |
N/A |
N/A |
N/A |
||
L. unicolor |
1591 |
8 |
N/A |
N/A |
N/A |
N/A |
||
M. ambigua |
1870 |
9 |
30 (13–42) |
7 (0–24) |
9 (0–31) |
52 (45–59) |
||
August |
N. erebi (small) |
22 |
0 |
43 (12–67) |
16 (1–51) |
21 (1–59) |
16 (3–30) |
|
N. erebi (large) |
380 |
4 |
17 (2–33) |
37 (15–61) |
34 (11–54) |
12 (4–20) |
||
C. carpio |
9184 |
88 |
12 (1–35) |
23 (2–50) |
19 (1–45) |
43 (31–56) |
||
C. auratus |
229 |
2 |
N/A |
N/A |
N/A |
N/A |
||
N. hyrtlii |
316 |
3 |
N/A |
N/A |
N/A |
N/A |
||
L. unicolor |
109 |
1 |
N/A |
N/A |
N/A |
N/A |
||
M. ambigua |
138 |
1 |
19 (2–39) |
19 (1–44) |
18 (1–44) |
42 (31–53) |
||
November |
N. erebi (small) |
17 |
0 |
44 (17–70) |
20 (1–49) |
27 (2–58) |
7 (0–21) |
|
N. erebi (large) |
387 |
0 |
39 (19–57) |
22 (2–48) |
24 (2–50) |
15 (6–24) |
||
C. carpio |
88659 |
97 |
11 (1–26) |
19 (2–41) |
17 (1–39) |
51 (44–58) |
||
L. unicolor |
1274 |
1 |
24 (3–45) |
15 (1–43) |
16 (1–44) |
41 (30–54) |
||
M. ambigua |
1130 |
1 |
21 (1–43) |
11 (1–45) |
14 (1–47) |
48 (36–60) |
||
Talwood |
June |
N. erebi (small) |
42 |
0 |
78 (63–90) |
6 (0–21) |
8 (0–28) |
5 (0–12) |
N. erebi (large) |
242 |
3 |
36 (18–55) |
28 (4–50) |
28 (4–51) |
9 (1–19) |
||
C. carpio |
1276 |
15 |
20 (2–41) |
22 (2–46) |
20 (1–45) |
37 (26–49) |
||
C. auratus |
484 |
6 |
N/A |
N/A |
N/A |
N/A |
||
L. unicolor |
1453 |
17 |
N/A |
N/A |
N/A |
N/A |
||
M. ambigua |
4993 |
59 |
35 (20–47) |
11 (1–30) |
15 (1–35) |
38 (31–45) |
||
August |
C. carpio |
2892 |
34 |
16 (1–38) |
26 (3–49) |
22 (2–46) |
36 (24–48) |
|
C. auratus |
930 |
11 |
N/A |
N/A |
N/A |
N/A |
||
L. unicolor |
548 |
6 |
N/A |
N/A |
N/A |
N/A |
||
M. ambigua |
4181 |
49 |
25 (9–39) |
23 (4–40) |
21 (3–40) |
32 (25–40) |
||
November |
N. erebi (large) |
8798 |
30 |
40 (27–53) |
25 (7–43) |
26 (7–44) |
9 (3–16) |
|
C. carpio |
18171 |
63 |
16 (4–28) |
26 (9–42) |
21 (4–38) |
37 (31–44) |
||
C. auratus |
715 |
2 |
12 (1–37) |
19 (1–48) |
15 (1–44) |
48 (35–65) |
||
L. unicolor |
834 |
3 |
26 (4–46) |
17 (1–42) |
18 (1–45) |
36 (25–48) |
||
M. ambigua |
424 |
1 |
25 (4–45) |
19 (1–43) |
19 (1–45) |
35 (24–47) |
||
Wyenbah |
June |
N. erebi (small) |
150 |
4 |
73 (62–82) |
4 (0–15) |
4 (0–17) |
18 (9–25) |
N. erebi (large) |
675 |
20 |
35 (14–54) |
26 (3–50) |
27 (3–51) |
12 (2–24) |
||
C. carpio |
1344 |
39 |
11 (1–33) |
23 (2–48) |
18 (1–44) |
45 (34–59) |
||
N. hyrtlii |
623 |
18 |
N/A |
N/A |
N/A |
N/A |
||
L. unicolor |
186 |
5 |
N/A |
N/A |
N/A |
N/A |
||
M. ambigua |
448 |
13 |
28 (6–45) |
10 (1–34) |
12 (1–40) |
46 (37–56) |
||
August |
N. erebi (small) |
79 |
5 |
59 (44–74) |
12 (1–33) |
21 (2–44) |
5 (0–13) |
|
C. carpio |
987 |
66 |
15 (1–37) |
17 (1–45) |
15 (1–42) |
49 (37–62) |
||
N. hyrtlii |
138 |
9 |
N/A |
N/A |
N/A |
N/A |
||
L. unicolor |
188 |
12 |
N/A |
N/A |
N/A |
N/A |
||
M. ambigua |
96 |
6 |
28 (5–47) |
16 (1–42) |
17 (1–45) |
36 (25–49) |
||
November |
N. erebi (small) |
208 |
5 |
54 (34–75) |
14 (1–41) |
23 (2–52) |
5 (0–15) |
|
N. erebi (large) |
1567 |
41 |
44 (26–62) |
21 (2–48) |
22 (2–49) |
11 (3–20) |
||
C. carpio |
1791 |
46 |
6 (0–19) |
27 (5–47) |
15 (1–36) |
50 (43–58) |
||
L. unicolor |
112 |
3 |
N/A |
N/A |
N/A |
N/A |
||
|
|
M. ambigua |
129 |
3 |
N/A |
N/A |
N/A |
N/A |
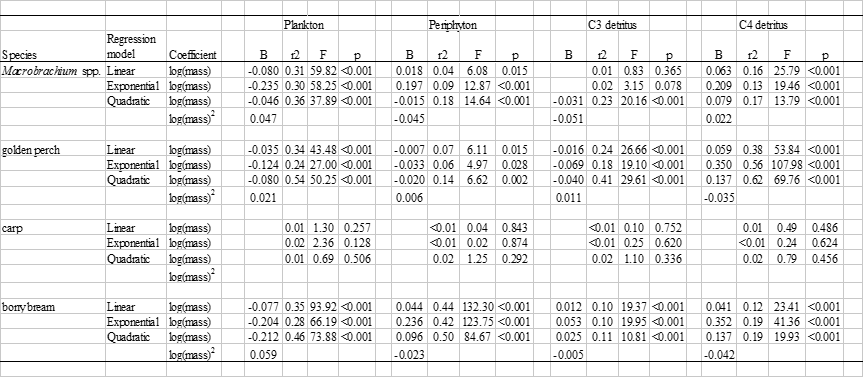
Table B3. Ordinary least squares regressions of dietary source proportions against log body mass (g) for four common and abundant species. Coefficients (B) are indicated for significant regressions.
Table B4. Fatty acid (% of total) profiles for primary producers in waterholes
Aquatic sources |
Terrestrial sources |
||||||||||||||||
FAME |
seston |
periphyton |
|
Leaf litter |
Herbaceous |
Grasses |
|||||||||||
14:0 |
5.9 |
± |
2.4 |
5.4 |
± |
2.2 |
4.5 |
± |
1.8 |
0.6 |
± |
0.5 |
0.8 |
± |
0.5 |
||
15:0 |
2.1 |
± |
1.2 |
1.3 |
± |
1.0 |
1.2 |
± |
0.6 |
0.2 |
± |
0.3 |
0.2 |
± |
0.2 |
||
16:0 |
26.3 |
± |
3.8 |
26.4 |
± |
4.0 |
22.3 |
± |
3.6 |
16.8 |
± |
3.0 |
17.8 |
± |
2.9 |
||
17:0 |
0.7 |
± |
0.3 |
0.4 |
± |
0.3 |
1.2 |
± |
0.5 |
0.2 |
± |
0.1 |
0.4 |
± |
0.1 |
||
18:0 |
14.0 |
± |
7.9 |
7.6 |
± |
5.4 |
6.1 |
± |
1.6 |
1.7 |
± |
0.8 |
2.3 |
± |
0.8 |
||
20:0 |
0.7 |
± |
0.4 |
0.6 |
± |
0.4 |
2.9 |
± |
0.7 |
0.6 |
± |
0.3 |
2.2 |
± |
3.4 |
||
21:0 |
0.0 |
± |
0.0 |
0.0 |
± |
0.0 |
0.5 |
± |
0.4 |
0.3 |
± |
0.2 |
0.5 |
± |
0.6 |
||
22:0 |
0.8 |
± |
0.6 |
0.8 |
± |
0.6 |
3.4 |
± |
1.2 |
1.1 |
± |
0.8 |
1.5 |
± |
0.9 |
||
23:0 |
0.0 |
± |
0.0 |
0.0 |
± |
0.1 |
1.3 |
± |
0.5 |
0.6 |
± |
0.6 |
1.2 |
± |
2.0 |
||
24:0 |
0.5 |
± |
1.0 |
0.8 |
± |
0.8 |
4.6 |
± |
3.2 |
1.7 |
± |
2.2 |
1.8 |
± |
0.9 |
||
26:0 |
0.1 |
± |
0.4 |
0.4 |
± |
0.7 |
4.7 |
± |
2.9 |
0.8 |
± |
0.7 |
1.0 |
± |
0.6 |
||
28:0 |
0.2 |
± |
0.8 |
0.5 |
± |
1.3 |
4.6 |
± |
3.7 |
0.6 |
± |
0.7 |
1.1 |
± |
1.1 |
||
∑SAFA |
51.3 |
± |
12.1 |
44.2 |
± |
8.4 |
57.5 |
± |
8.8 |
25.3 |
± |
5.3 |
31.0 |
± |
7.3 |
||
14:1w5 |
0.1 |
± |
0.2 |
0.1 |
± |
0.3 |
0.1 |
± |
0.2 |
0.0 |
± |
0.0 |
0.0 |
± |
0.0 |
||
16:1w9 |
3.6 |
± |
2.5 |
2.3 |
± |
2.2 |
0.9 |
± |
0.9 |
0.2 |
± |
0.2 |
0.3 |
± |
0.2 |
||
16:1w7 |
4.0 |
± |
1.8 |
15.2 |
± |
8.7 |
3.1 |
± |
1.8 |
0.2 |
± |
0.1 |
0.1 |
± |
0.1 |
||
18:1w9 |
10.2 |
± |
6.3 |
8.2 |
± |
4.1 |
8.8 |
± |
4.2 |
5.7 |
± |
4.7 |
3.3 |
± |
2.3 |
||
18:1w7 |
2.4 |
± |
0.6 |
2.0 |
± |
1.0 |
3.7 |
± |
1.7 |
0.5 |
± |
0.2 |
0.5 |
± |
0.2 |
||
20:1w9 |
0.1 |
± |
0.2 |
0.5 |
± |
0.5 |
0.2 |
± |
0.4 |
0.1 |
± |
0.1 |
0.1 |
± |
0.1 |
||
24:1w9 |
0.1 |
± |
0.4 |
0.2 |
± |
0.4 |
0.2 |
± |
0.4 |
0.0 |
± |
0.1 |
0.0 |
± |
0.0 |
||
∑MUFA |
22.5 |
± |
8.0 |
34.1 |
± |
7.2 |
17.4 |
± |
5.4 |
7.2 |
± |
5.2 |
4.6 |
± |
2.4 |
||
18:2w6 |
3.9 |
± |
4.0 |
3.7 |
± |
1.7 |
9.8 |
± |
5.0 |
19.6 |
± |
5.5 |
19.9 |
± |
5.8 |
||
18:3w3 |
6.4 |
± |
5.0 |
4.5 |
± |
4.0 |
7.1 |
± |
8.9 |
47.3 |
± |
10.6 |
44.0 |
± |
12.3 |
||
18:4w3 |
2.2 |
± |
3.0 |
0.4 |
± |
0.4 |
0.0 |
± |
0.0 |
0.0 |
± |
0.0 |
0.0 |
± |
0.0 |
||
20:3w6 |
0.0 |
± |
0.1 |
0.2 |
± |
0.2 |
0.4 |
± |
0.7 |
0.0 |
± |
0.1 |
0.0 |
± |
0.1 |
||
20:4w6 |
0.6 |
± |
0.7 |
1.3 |
± |
0.7 |
0.9 |
± |
0.6 |
0.1 |
± |
0.4 |
0.0 |
± |
0.1 |
||
20:3w3 |
0.1 |
± |
0.2 |
0.1 |
± |
0.2 |
0.0 |
± |
0.1 |
0.1 |
± |
0.1 |
0.1 |
± |
0.1 |
||
20:5w3 |
2.7 |
± |
2.0 |
5.2 |
± |
3.0 |
0.8 |
± |
0.7 |
0.0 |
± |
0.0 |
0.0 |
± |
0.0 |
||
22:5w3 |
0.0 |
± |
0.0 |
0.1 |
± |
0.1 |
0.1 |
± |
0.3 |
0.1 |
± |
0.1 |
0.0 |
± |
0.1 |
||
22:6w3 |
1.6 |
± |
2.0 |
1.1 |
± |
0.9 |
0.4 |
± |
0.6 |
0.0 |
± |
0.1 |
0.0 |
± |
0.0 |
||
∑PUFA |
21.8 |
± |
14.2 |
18.6 |
± |
8.0 |
20.2 |
± |
12.3 |
67.5 |
± |
8.8 |
64.3 |
± |
7.9 |
||
w3:w6 |
3.0 |
± |
2.5 |
2.1 |
± |
1.4 |
|
0.7 |
± |
0.5 |
2.6 |
± |
1.2 |
2.4 |
± |
1.0 |
|
Table B5. Fatty acid (% of total) profiles for invertebrates in waterholes
Terrestrial insects |
||||||||||
FAME |
Formicidae |
Orthoptera |
|
Zooplankton |
||||||
14:0 |
1.0 |
± |
0.8 |
2.4 |
± |
3.0 |
3.5 |
± |
0.8 |
|
15:0 |
0.2 |
± |
0.4 |
0.2 |
± |
0.3 |
1.5 |
± |
0.4 |
|
16:0 |
15.2 |
± |
8.6 |
21.0 |
± |
10.3 |
16.5 |
± |
1.7 |
|
17:0 |
0.4 |
± |
0.3 |
1.0 |
± |
1.2 |
1.2 |
± |
0.3 |
|
18:0 |
9.2 |
± |
3.2 |
9.1 |
± |
3.2 |
4.1 |
± |
1.0 |
|
20:0 |
0.9 |
± |
0.4 |
0.6 |
± |
0.7 |
0.3 |
± |
0.1 |
|
21:0 |
0.0 |
± |
0.1 |
0.2 |
± |
0.4 |
0.1 |
± |
0.1 |
|
22:0 |
0.5 |
± |
0.3 |
0.3 |
± |
0.3 |
0.4 |
± |
0.1 |
|
23:0 |
0.3 |
± |
0.9 |
0.0 |
± |
0.1 |
0.1 |
± |
0.0 |
|
24:0 |
0.4 |
± |
0.8 |
0.1 |
± |
0.3 |
0.2 |
± |
0.1 |
|
26:0 |
0.0 |
± |
0.1 |
0.1 |
± |
0.2 |
0.0 |
± |
0.0 |
|
28:0 |
0.4 |
± |
0.4 |
0.3 |
± |
0.5 |
0.5 |
± |
0.3 |
|
∑SAFA |
28.7 |
± |
10.1 |
35.6 |
± |
9.3 |
28.5 |
± |
3.2 |
|
14:1w5 |
0.3 |
± |
0.2 |
0.0 |
± |
0.1 |
0.0 |
± |
0.0 |
|
16:1w9 |
0.6 |
± |
0.6 |
0.4 |
± |
0.4 |
0.9 |
± |
0.8 |
|
16:1w7 |
3.6 |
± |
2.6 |
2.0 |
± |
1.9 |
3.9 |
± |
2.1 |
|
18:1w9 |
44.9 |
± |
10.5 |
19.3 |
± |
9.0 |
3.5 |
± |
2.6 |
|
18:1w7 |
0.9 |
± |
0.5 |
0.7 |
± |
0.6 |
3.6 |
± |
1.2 |
|
20:1w9 |
0.1 |
± |
0.1 |
0.1 |
± |
0.1 |
0.4 |
± |
0.1 |
|
24:1w9 |
0.0 |
± |
0.0 |
0.0 |
± |
0.2 |
0.7 |
± |
0.2 |
|
∑MUFA |
50.7 |
± |
10.0 |
22.8 |
± |
9.3 |
13.6 |
± |
4.6 |
|
18:2w6 |
16.2 |
± |
8.3 |
17.1 |
± |
10.7 |
2.8 |
± |
1.2 |
|
18:3w3 |
1.5 |
± |
1.3 |
23.7 |
± |
12.1 |
10.1 |
± |
2.3 |
|
18:4w3 |
0.0 |
± |
0.0 |
0.0 |
± |
0.0 |
2.6 |
± |
1.3 |
|
20:3w6 |
0.0 |
± |
0.0 |
0.0 |
± |
0.0 |
0.2 |
± |
0.1 |
|
20:4w6 |
1.4 |
± |
1.3 |
0.1 |
± |
0.2 |
3.3 |
± |
1.2 |
|
20:3w3 |
0.0 |
± |
0.0 |
0.1 |
± |
0.1 |
0.8 |
± |
0.3 |
|
20:5w3 |
0.7 |
± |
0.7 |
0.1 |
± |
0.3 |
13.7 |
± |
2.3 |
|
22:5w3 |
0.0 |
± |
0.0 |
0.0 |
± |
0.0 |
0.8 |
± |
0.2 |
|
22:6w3 |
0.0 |
± |
0.0 |
0.0 |
± |
0.0 |
12.8 |
± |
3.8 |
|
∑PUFA |
20.4 |
± |
10.5 |
41.2 |
± |
14.0 |
54.6 |
± |
7.2 |
|
w3:w6 |
0.1 |
± |
0.1 |
1.8 |
± |
1.2 |
|
6.3 |
± |
2.4 |
Table B5 (continued)
Aquatic insects |
||||||||||||||||||||||||||||
Herbivores |
Predators |
|||||||||||||||||||||||||||
FAME |
Ephemeroptera |
Chironomidae |
Corixidae |
Coleoptera |
Trichoptera |
|
Dytiscidae |
Gerridae |
Notonectidae |
Odonata |
||||||||||||||||||
14:0 |
2.4 |
± |
1.1 |
2.5 |
± |
1.8 |
2.6 |
± |
0.8 |
1.9 |
± |
0.4 |
1.9 |
± |
1.8 |
0.8 |
± |
0.4 |
1.5 |
± |
0.5 |
1.0 |
± |
0.5 |
1.6 |
± |
0.7 |
|
15:0 |
0.9 |
± |
0.6 |
1.4 |
± |
0.7 |
1.5 |
± |
0.8 |
0.8 |
± |
0.4 |
0.6 |
± |
0.3 |
0.3 |
± |
0.1 |
0.2 |
± |
0.3 |
0.6 |
± |
0.2 |
1.0 |
± |
0.3 |
|
16:0 |
23.3 |
± |
5.1 |
22.2 |
± |
1.8 |
20.8 |
± |
3.8 |
22.2 |
± |
3.0 |
21.4 |
± |
5.6 |
20.4 |
± |
7.1 |
18.9 |
± |
3.6 |
21.3 |
± |
8.2 |
16.5 |
± |
2.9 |
|
17:0 |
1.2 |
± |
0.8 |
1.7 |
± |
0.2 |
1.1 |
± |
0.3 |
0.7 |
± |
0.3 |
1.6 |
± |
0.4 |
0.8 |
± |
0.2 |
0.5 |
± |
0.2 |
1.6 |
± |
0.3 |
2.8 |
± |
0.5 |
|
18:0 |
10.4 |
± |
10.0 |
13.5 |
± |
5.2 |
7.2 |
± |
3.1 |
5.7 |
± |
1.0 |
8.2 |
± |
3.6 |
6.6 |
± |
1.2 |
8.9 |
± |
1.8 |
11.0 |
± |
3.6 |
11.5 |
± |
3.5 |
|
20:0 |
0.3 |
± |
0.2 |
1.2 |
± |
0.4 |
0.3 |
± |
0.1 |
0.3 |
± |
0.1 |
0.4 |
± |
0.3 |
0.4 |
± |
0.2 |
0.4 |
± |
0.1 |
0.3 |
± |
0.1 |
0.9 |
± |
0.2 |
|
21:0 |
0.0 |
± |
0.0 |
0.0 |
± |
0.0 |
0.0 |
± |
0.0 |
0.0 |
± |
0.0 |
0.0 |
± |
0.0 |
0.1 |
± |
0.1 |
0.0 |
± |
0.0 |
0.0 |
± |
0.0 |
0.1 |
± |
0.1 |
|
22:0 |
0.4 |
± |
0.2 |
0.2 |
± |
0.3 |
0.3 |
± |
0.1 |
0.3 |
± |
0.1 |
0.3 |
± |
0.3 |
0.2 |
± |
0.1 |
0.3 |
± |
0.1 |
0.4 |
± |
0.2 |
0.6 |
± |
0.2 |
|
23:0 |
0.0 |
± |
0.0 |
0.0 |
± |
0.0 |
0.0 |
± |
0.0 |
0.0 |
± |
0.0 |
0.0 |
± |
0.0 |
0.0 |
± |
0.0 |
0.0 |
± |
0.0 |
0.0 |
± |
0.0 |
0.0 |
± |
0.0 |
|
24:0 |
0.0 |
± |
0.0 |
0.0 |
± |
0.0 |
0.0 |
± |
0.0 |
0.0 |
± |
0.0 |
0.0 |
± |
0.1 |
0.0 |
± |
0.0 |
0.1 |
± |
0.1 |
0.0 |
± |
0.0 |
0.2 |
± |
0.3 |
|
26:0 |
0.0 |
± |
0.0 |
0.0 |
± |
0.0 |
0.0 |
± |
0.0 |
0.0 |
± |
0.0 |
0.0 |
± |
0.0 |
0.0 |
± |
0.0 |
0.0 |
± |
0.0 |
0.0 |
± |
0.0 |
0.0 |
± |
0.0 |
|
28:0 |
1.1 |
± |
3.6 |
0.4 |
± |
0.7 |
0.1 |
± |
0.2 |
0.2 |
± |
0.2 |
0.2 |
± |
0.5 |
0.1 |
± |
0.1 |
0.3 |
± |
0.6 |
0.2 |
± |
0.3 |
0.4 |
± |
0.5 |
|
∑SAFA |
40.0 |
± |
16.9 |
43.3 |
± |
4.6 |
34.0 |
± |
2.2 |
32.1 |
± |
1.9 |
34.9 |
± |
4.8 |
29.8 |
± |
6.2 |
31.1 |
± |
3.5 |
36.5 |
± |
5.1 |
35.9 |
± |
4.7 |
|
14:1w5 |
0.0 |
± |
0.0 |
0.1 |
± |
0.2 |
0.1 |
± |
0.1 |
0.0 |
± |
0.0 |
0.1 |
± |
0.1 |
0.0 |
± |
0.0 |
0.0 |
± |
0.1 |
0.0 |
± |
0.0 |
0.0 |
± |
0.1 |
|
16:1w9 |
0.6 |
± |
0.3 |
0.6 |
± |
0.1 |
0.6 |
± |
0.2 |
1.4 |
± |
2.1 |
0.6 |
± |
0.3 |
0.6 |
± |
0.2 |
0.4 |
± |
0.3 |
0.3 |
± |
0.2 |
0.6 |
± |
0.4 |
|
16:1w7 |
9.4 |
± |
4.9 |
6.8 |
± |
1.7 |
11.2 |
± |
5.1 |
10.5 |
± |
4.0 |
4.7 |
± |
2.0 |
2.7 |
± |
1.5 |
3.7 |
± |
1.0 |
4.7 |
± |
2.7 |
4.2 |
± |
1.9 |
|
18:1w9 |
8.3 |
± |
3.6 |
9.6 |
± |
3.3 |
17.1 |
± |
2.7 |
23.4 |
± |
6.1 |
20.1 |
± |
5.4 |
27.2 |
± |
4.8 |
34.2 |
± |
6.0 |
15.2 |
± |
1.7 |
11.6 |
± |
3.5 |
|
18:1w7 |
9.9 |
± |
4.2 |
6.1 |
± |
1.5 |
1.8 |
± |
0.5 |
3.1 |
± |
1.4 |
2.2 |
± |
0.8 |
1.9 |
± |
0.4 |
1.4 |
± |
0.4 |
1.9 |
± |
0.6 |
8.4 |
± |
1.1 |
|
20:1w9 |
0.0 |
± |
0.1 |
0.0 |
± |
0.0 |
0.2 |
± |
0.1 |
0.1 |
± |
0.0 |
0.1 |
± |
0.1 |
0.2 |
± |
0.2 |
0.2 |
± |
0.0 |
0.1 |
± |
0.1 |
0.1 |
± |
0.1 |
|
24:1w9 |
0.1 |
± |
0.4 |
0.0 |
± |
0.0 |
0.0 |
± |
0.1 |
0.0 |
± |
0.0 |
0.0 |
± |
0.1 |
0.0 |
± |
0.0 |
0.0 |
± |
0.0 |
0.0 |
± |
0.0 |
0.0 |
± |
0.0 |
|
∑MUFA |
28.6 |
± |
10.3 |
23.5 |
± |
2.3 |
31.5 |
± |
5.4 |
38.9 |
± |
3.8 |
28.1 |
± |
5.5 |
32.9 |
± |
6.2 |
40.0 |
± |
6.4 |
22.5 |
± |
4.4 |
25.2 |
± |
5.2 |
|
18:2w6 |
5.9 |
± |
3.5 |
17.2 |
± |
4.9 |
7.2 |
± |
2.6 |
7.4 |
± |
2.1 |
14.5 |
± |
7.1 |
17.4 |
± |
5.7 |
17.5 |
± |
4.5 |
7.2 |
± |
2.3 |
10.6 |
± |
2.6 |
|
18:3w3 |
6.8 |
± |
4.7 |
3.0 |
± |
2.3 |
8.2 |
± |
2.8 |
5.9 |
± |
1.6 |
6.7 |
± |
4.8 |
9.4 |
± |
8.5 |
2.3 |
± |
0.8 |
8.2 |
± |
1.6 |
4.4 |
± |
1.8 |
|
18:4w3 |
0.3 |
± |
0.2 |
0.1 |
± |
0.1 |
0.3 |
± |
0.2 |
0.5 |
± |
0.3 |
0.2 |
± |
0.3 |
0.0 |
± |
0.0 |
0.1 |
± |
0.1 |
0.4 |
± |
0.2 |
0.3 |
± |
0.2 |
|
20:3w6 |
0.1 |
± |
0.1 |
0.2 |
± |
0.2 |
0.3 |
± |
0.1 |
0.3 |
± |
0.1 |
0.2 |
± |
0.1 |
0.2 |
± |
0.1 |
0.1 |
± |
0.0 |
0.2 |
± |
0.0 |
0.3 |
± |
0.2 |
|
20:4w6 |
4.4 |
± |
1.7 |
3.0 |
± |
1.2 |
4.0 |
± |
1.3 |
4.1 |
± |
1.8 |
4.5 |
± |
2.5 |
5.4 |
± |
4.1 |
3.9 |
± |
1.1 |
5.8 |
± |
1.0 |
7.3 |
± |
1.4 |
|
20:3w3 |
0.1 |
± |
0.1 |
0.0 |
± |
0.0 |
0.2 |
± |
0.1 |
0.1 |
± |
0.0 |
0.0 |
± |
0.1 |
0.1 |
± |
0.1 |
0.0 |
± |
0.0 |
0.1 |
± |
0.1 |
0.3 |
± |
0.3 |
|
20:5w3 |
10.6 |
± |
4.7 |
3.8 |
± |
2.4 |
9.5 |
± |
3.0 |
6.1 |
± |
2.8 |
7.1 |
± |
5.4 |
2.8 |
± |
2.6 |
3.9 |
± |
1.0 |
15.3 |
± |
4.0 |
10.2 |
± |
1.9 |
|
22:5w3 |
0.0 |
± |
0.0 |
0.0 |
± |
0.0 |
0.3 |
± |
0.4 |
0.1 |
± |
0.1 |
0.0 |
± |
0.0 |
0.1 |
± |
0.1 |
0.0 |
± |
0.0 |
0.1 |
± |
0.1 |
0.0 |
± |
0.1 |
|
22:6w3 |
0.2 |
± |
0.2 |
0.0 |
± |
0.0 |
1.2 |
± |
1.4 |
0.6 |
± |
0.3 |
0.3 |
± |
0.4 |
0.3 |
± |
0.4 |
0.1 |
± |
0.1 |
1.2 |
± |
0.8 |
0.7 |
± |
1.2 |
|
∑PUFA |
30.1 |
± |
10.3 |
28.7 |
± |
5.1 |
33.7 |
± |
6.8 |
27.4 |
± |
5.1 |
34.8 |
± |
7.1 |
36.7 |
± |
12.4 |
28.4 |
± |
5.4 |
40.2 |
± |
9.2 |
36.1 |
± |
4.5 |
|
n3:n6 |
1.9 |
± |
1.1 |
0.4 |
± |
0.3 |
1.6 |
± |
0.5 |
1.1 |
± |
0.5 |
1.1 |
± |
1.2 |
|
0.5 |
± |
0.3 |
0.3 |
± |
0.1 |
1.9 |
± |
0.2 |
0.9 |
± |
0.3 |
Table B6. Fatty acid (% of total) for fishes in waterholes.
FAME |
carp |
golden perch |
bony bream (>100mm) |
hyrtl's tandan |
spangled perch |
goldfish |
bony bream (<100 mm) |
||||||||||||||
14:0 |
0.6 |
± |
0.4 |
1.8 |
± |
1.0 |
2.6 |
± |
1.8 |
1.4 |
± |
0.2 |
1.1 |
± |
0.4 |
0.4 |
± |
0.1 |
3.7 |
± |
2.5 |
15:0 |
0.5 |
± |
0.2 |
0.6 |
± |
0.2 |
1.2 |
± |
0.8 |
0.6 |
± |
0.1 |
0.7 |
± |
0.2 |
0.7 |
± |
0.4 |
1.9 |
± |
2.2 |
16:0 |
19.2 |
± |
2.1 |
22.3 |
± |
2.9 |
25.5 |
± |
3.4 |
21.7 |
± |
0.6 |
21.2 |
± |
1.0 |
18.1 |
± |
1.4 |
24.9 |
± |
2.4 |
17:0 |
0.6 |
± |
0.2 |
0.9 |
± |
0.3 |
1.0 |
± |
0.5 |
0.8 |
± |
0.3 |
0.8 |
± |
0.2 |
1.1 |
± |
0.4 |
1.0 |
± |
0.6 |
18:0 |
7.3 |
± |
1.3 |
7.8 |
± |
2.0 |
6.0 |
± |
1.4 |
8.6 |
± |
0.2 |
8.4 |
± |
0.7 |
10.3 |
± |
1.0 |
5.3 |
± |
1.6 |
20:0 |
0.2 |
± |
0.1 |
0.3 |
± |
0.1 |
0.2 |
± |
0.1 |
0.5 |
± |
0.1 |
0.3 |
± |
0.1 |
0.2 |
± |
0.1 |
0.2 |
± |
0.1 |
21:0 |
0.0 |
± |
0.1 |
0.0 |
± |
0.0 |
0.0 |
± |
0.1 |
0.0 |
± |
0.0 |
0.0 |
± |
0.0 |
0.0 |
± |
0.0 |
0.1 |
± |
0.1 |
22:0 |
0.2 |
± |
0.1 |
0.2 |
± |
0.1 |
0.2 |
± |
0.1 |
0.3 |
± |
0.0 |
0.2 |
± |
0.1 |
0.2 |
± |
0.0 |
0.2 |
± |
0.1 |
23:0 |
0.0 |
± |
0.0 |
0.0 |
± |
0.0 |
0.0 |
± |
0.1 |
0.0 |
± |
0.0 |
0.0 |
± |
0.0 |
0.0 |
± |
0.0 |
0.0 |
± |
0.0 |
24:0 |
0.0 |
± |
0.1 |
0.1 |
± |
0.1 |
0.2 |
± |
0.1 |
0.1 |
± |
0.1 |
0.2 |
± |
0.0 |
0.2 |
± |
0.3 |
0.3 |
± |
0.1 |
26:0 |
0.0 |
± |
0.0 |
0.0 |
± |
0.0 |
0.0 |
± |
0.0 |
0.0 |
± |
0.1 |
0.0 |
± |
0.0 |
0.0 |
± |
0.1 |
0.0 |
± |
0.0 |
28:0 |
0.5 |
± |
0.7 |
1.1 |
± |
2.0 |
0.3 |
± |
0.5 |
0.1 |
± |
0.1 |
0.4 |
± |
0.2 |
0.4 |
± |
0.6 |
0.2 |
± |
0.3 |
∑SAFA |
29.3 |
± |
2.6 |
35.4 |
± |
5.6 |
37.5 |
± |
4.2 |
34.4 |
± |
0.5 |
33.5 |
± |
1.2 |
32.1 |
± |
2.3 |
37.9 |
± |
3.8 |
14:1w5 |
0.0 |
± |
0.0 |
0.0 |
± |
0.0 |
0.0 |
± |
0.0 |
0.0 |
± |
0.0 |
0.0 |
± |
0.0 |
0.0 |
± |
0.0 |
0.0 |
± |
0.0 |
16:1w9 |
0.5 |
± |
0.3 |
0.9 |
± |
1.4 |
0.5 |
± |
0.3 |
0.5 |
± |
0.4 |
1.2 |
± |
1.4 |
0.7 |
± |
0.5 |
0.6 |
± |
0.3 |
16:1w7 |
2.2 |
± |
1.2 |
3.7 |
± |
2.1 |
4.4 |
± |
4.5 |
4.4 |
± |
1.5 |
2.6 |
± |
1.1 |
1.1 |
± |
0.3 |
4.2 |
± |
3.7 |
18:1w9 |
15.3 |
± |
6.8 |
14.3 |
± |
6.6 |
7.2 |
± |
4.7 |
24.8 |
± |
10.1 |
11.7 |
± |
5.1 |
8.6 |
± |
4.9 |
5.6 |
± |
3.1 |
18:1w7 |
2.4 |
± |
0.6 |
2.6 |
± |
0.7 |
2.0 |
± |
0.6 |
3.7 |
± |
0.2 |
2.2 |
± |
0.5 |
2.4 |
± |
0.4 |
1.9 |
± |
0.4 |
20:1w9 |
1.0 |
± |
0.7 |
0.5 |
± |
0.2 |
0.5 |
± |
0.5 |
2.3 |
± |
0.8 |
0.4 |
± |
0.2 |
0.6 |
± |
0.3 |
0.3 |
± |
0.3 |
24:1w9 |
0.2 |
± |
0.1 |
0.4 |
± |
0.2 |
0.2 |
± |
0.1 |
0.1 |
± |
0.1 |
0.4 |
± |
0.1 |
0.3 |
± |
0.1 |
0.2 |
± |
0.1 |
∑MUFA |
22.0 |
± |
7.9 |
23.2 |
± |
10.0 |
15.5 |
± |
10.0 |
36.1 |
± |
11.7 |
19.0 |
± |
7.8 |
14.0 |
± |
4.8 |
13.8 |
± |
7.7 |
18:2w6 |
12.3 |
± |
5.8 |
5.7 |
± |
1.9 |
2.9 |
± |
0.7 |
3.7 |
± |
0.5 |
5.1 |
± |
2.1 |
6.3 |
± |
3.3 |
2.9 |
± |
0.9 |
18:3w3 |
2.1 |
± |
2.4 |
2.0 |
± |
1.2 |
4.1 |
± |
1.6 |
1.6 |
± |
0.1 |
1.3 |
± |
0.7 |
1.7 |
± |
0.9 |
6.6 |
± |
3.4 |
18:4w3 |
0.2 |
± |
0.1 |
0.2 |
± |
0.2 |
0.2 |
± |
0.2 |
0.2 |
± |
0.0 |
0.2 |
± |
0.1 |
0.3 |
± |
0.1 |
0.6 |
± |
0.6 |
20:3w6 |
1.1 |
± |
0.3 |
0.6 |
± |
0.1 |
0.5 |
± |
0.1 |
0.7 |
± |
0.2 |
0.8 |
± |
0.1 |
0.8 |
± |
0.5 |
0.5 |
± |
0.1 |
20:4w6 |
12.8 |
± |
4.9 |
8.8 |
± |
4.1 |
9.8 |
± |
4.0 |
4.9 |
± |
2.7 |
9.8 |
± |
3.2 |
15.1 |
± |
0.7 |
8.3 |
± |
4.4 |
20:3w3 |
0.3 |
± |
0.2 |
0.3 |
± |
0.1 |
0.3 |
± |
0.1 |
0.3 |
± |
0.1 |
0.3 |
± |
0.2 |
0.4 |
± |
0.2 |
0.4 |
± |
0.1 |
20:5w3 |
3.9 |
± |
1.8 |
3.1 |
± |
1.5 |
7.3 |
± |
1.7 |
2.2 |
± |
0.9 |
1.4 |
± |
0.5 |
4.7 |
± |
0.8 |
8.0 |
± |
2.9 |
22:5w3 |
2.1 |
± |
0.9 |
3.5 |
± |
1.8 |
1.4 |
± |
0.4 |
1.9 |
± |
0.7 |
2.6 |
± |
0.7 |
2.4 |
± |
0.2 |
1.4 |
± |
0.6 |
22:6w3 |
10.5 |
± |
5.0 |
11.4 |
± |
6.4 |
16.2 |
± |
8.6 |
9.3 |
± |
7.8 |
21.4 |
± |
6.3 |
18.0 |
± |
5.7 |
14.1 |
± |
7.7 |
∑PUFA |
47.2 |
± |
6.8 |
39.9 |
± |
10.1 |
45.8 |
± |
13.2 |
26.5 |
± |
13.2 |
46.1 |
± |
6.9 |
51.8 |
± |
4.6 |
47.1 |
± |
10.4 |
w3:w6 |
0.7 |
± |
0.3 |
1.2 |
± |
0.6 |
2.1 |
± |
0.4 |
1.5 |
± |
0.4 |
1.6 |
± |
0.6 |
1.2 |
± |
0.4 |
2.4 |
± |
0.7 |
Table B7. Regression relationships between individual PUFA (% fatty acid) and proportion of the diet derived from aquatic sources for insects, crustaceans and fishes in waterholes of the Border Rivers system, Queensland, Australia. Coefficients (B) are indicated for significant regressions.
PUFA |
Taxon |
n |
r² |
B |
F |
p |
ALA |
herbivorous insects |
44 |
0.02 |
|
0.65 |
0.423 |
ALA |
predatory insects |
32 |
0.05 |
|
1.88 |
0.179 |
EPA |
herbivorous insects |
44 |
0.10 |
0.13 |
4.85 |
0.033 |
EPA |
predatory insects |
32 |
0.28 |
0.31 |
13.01 |
0.001 |
DHA |
herbivorous insects |
44 |
0.01 |
|
0.23 |
0.631 |
DHA |
predatory insects |
32 |
0.17 |
0.05 |
6.72 |
0.014 |
|
||||||
LIN |
herbivorous insects |
44 |
0.01 |
|
0.37 |
0.547 |
LIN |
predatory insects |
32 |
0.15 |
–0.26 |
6.03 |
0.020 |
ARA |
herbivorous insects |
44 |
0.01 |
|
0.38 |
0.540 |
ARA |
predatory insects |
32 |
0.01 |
|
0.34 |
0.565 |
|
||||||
ALA |
prawns |
28 |
0.30 |
0.07 |
12.18 |
0.002 |
EPA |
prawns |
28 |
0.02 |
|
0.67 |
0.419 |
DHA |
prawns |
28 |
0.23 |
0.12 |
8.78 |
0.006 |
|
||||||
LIN |
prawns |
28 |
0.11 |
|
3.50 |
0.071 |
ARA |
prawns |
28 |
0.25 |
-0.26 |
9.88 |
0.004 |
|
||||||
ALA |
fishes |
128 |
0.22 |
0.10 |
35.27 |
<0.001 |
EPA |
fishes |
128 |
0.32 |
0.17 |
59.14 |
<0.001 |
DHA |
fishes |
128 |
0.12 |
0.24 |
17.01 |
<0.001 |
|
||||||
LIN |
fishes |
128 |
0.31 |
-0.27 |
58.43 |
<0.001 |
ARA |
fishes |
128 |
<0.01 |
|
0.41 |
0.525 |
Literature cited
Goedkoop, W., L. Sonesten, G. Ahlgren, and M. Boberg. 2000. Fatty acids in profundal invertebrates and their major food resources in Lake Erken, Sweden: seasonal variation and trophic interactions. Canadian Journal of Fisheries and Aquatic Sciences 57:2267–2279.
Hebert, C. E., D. V. C. Weseloh, A. Idrissi, M. T. Arts, R. O'Gorman, O. T. Gorman, B. Locke, C. P. Madenjian, and E. F. Roseman. 2008. Restoring piscivorous fish populations in the Laurentian Great Lakes causes seabird dietary change. Ecology 89:891–897.
Jardine. T. D., K. A. Kidd, J. T. Polhemus, and R. A. Cunjak. 2008. An elemental and stable isotope assessment of water strider feeding ecology and lipid dynamics: synthesis of lab and field studies. Freshwater Biology 53:2192–2205.
Kainz, M., M. Lucotte, and C. C. Parrish. 2002. Methyl mercury in zooplankton – the role of size, habitat, and food quality. Canadian Journal of Fisheries and Aquatic Sciences 59:1606–1615.
Lau, D. C. P., T. Vrede, J. Pickova, and W. Goedkoop. 2012. Fatty acid composition of consumers in boreal lakes – variation across species, space and time. Freshwater Biology 57:24–38.
Lau, D. C. P., W. Goedkoop, and T. Vrede. 2013. Cross-ecosystem differences in lipid composition and growth limitation of a benthic generalist consumer. Limnology and Oceanography 58:1149–1164.
Napolitano, G. E. 1999. Fatty acids as trophic and chemical markers in freshwater ecosystems Pages 21–37 in M. T. Arts and B. C. Wainman, editors. Lipids in freshwater ecosystems. Springer-Verlag, New York, New York, USA.
Sushchik, N. N., M. I. Gladyshev, E. A. Ivanova, and E. S. Kravchuk. 2010. Seasonal distribution and fatty acid composition of littoral microalgae in the Yenisei River. Journal of Applied Phycology 22:11–24.