Ecological Archives E096-279-A7
Wojciech Uszko, Sebastian Diehl, Nadine Pitsch, Kathrin Lengfellner, and Thomas Müller. 2015. When is a type III functional response stabilizing? Theory and practice of predicting plankton dynamics under enrichment. Ecology 96:32433256. http://dx.doi.org/10.1890/15-0055.1
Appendix G. Residuals plots and sensitivity to parameters.
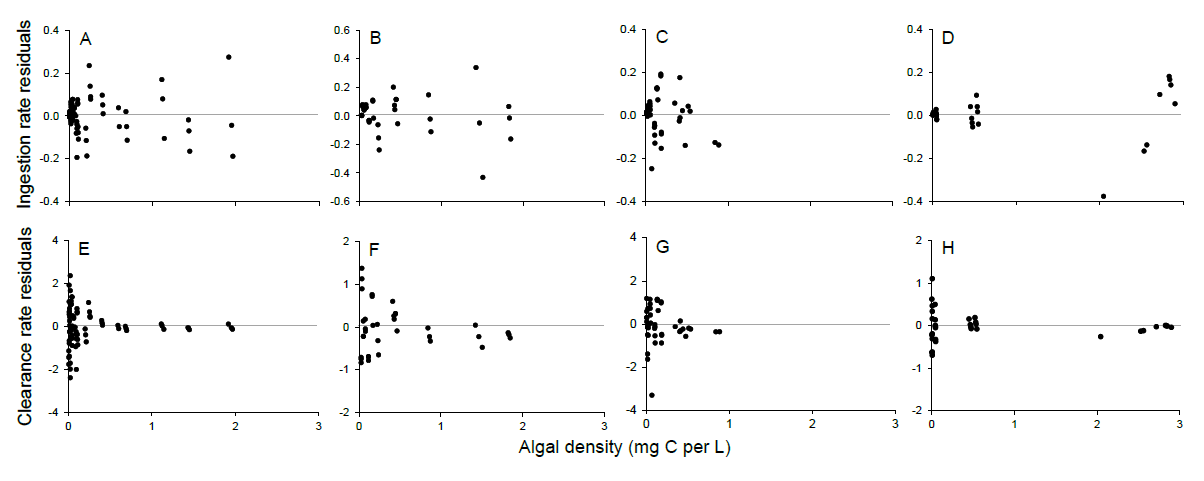
Fig. G1. Residuals from the nonlinear regression best fit type III functional responses fitted to in ingestion rate (mg C per mg C of Daphnia per d; panels A–D) and clearance rate (L per mg C of Daphnia per d; panels E–H) as shown in Fig.2. Species pairs are: D. hyalina and M. minutum at 20°C (A and E) and 14°C (B and F), D. hyalina and C. meneghiniana at 16°C (C and G), D. magna and M. minutum at 16°C (D and H).
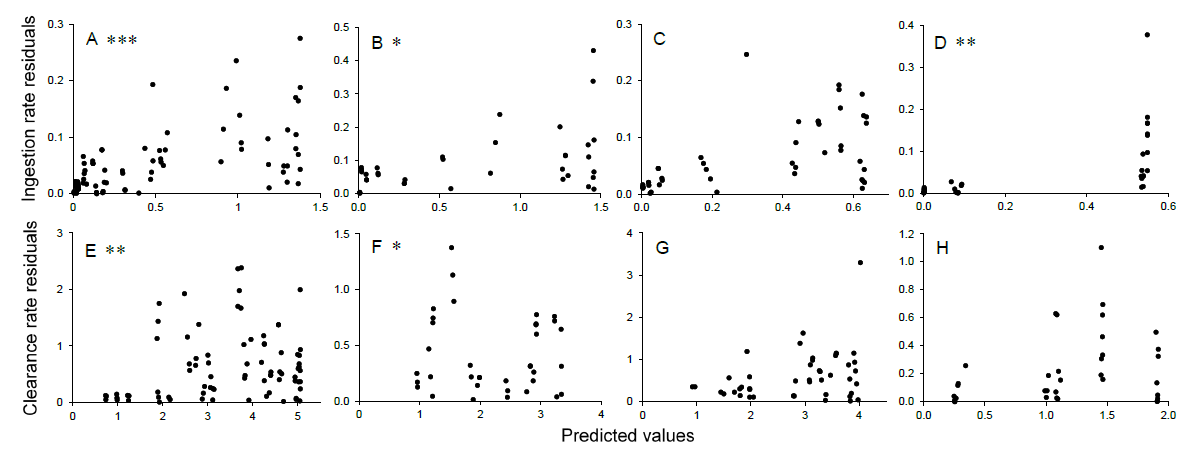
Fig. G2. Residuals from the nonlinear regression best fit type III functional responses fitted to ingestion rate (mg C per mg C of Daphnia per d; panels A–D) and clearance rate (L per mg C of Daphnia per d; panels E–H) as shown in Fig. 2 plotted against predicted values. Species pairs are: D. hyalina and M. minutum at 20°C (A and E) and 14°C (B and F), D. hyalina and C. meneghiniana at 16°C (C and G), D. magna and M. minutum at 16°C (D and H). Significant heteroscedasticity detected with the Breusch-Pagan test is marked by * (p <0.05), ** (p <0.01) or *** (p <0.001).
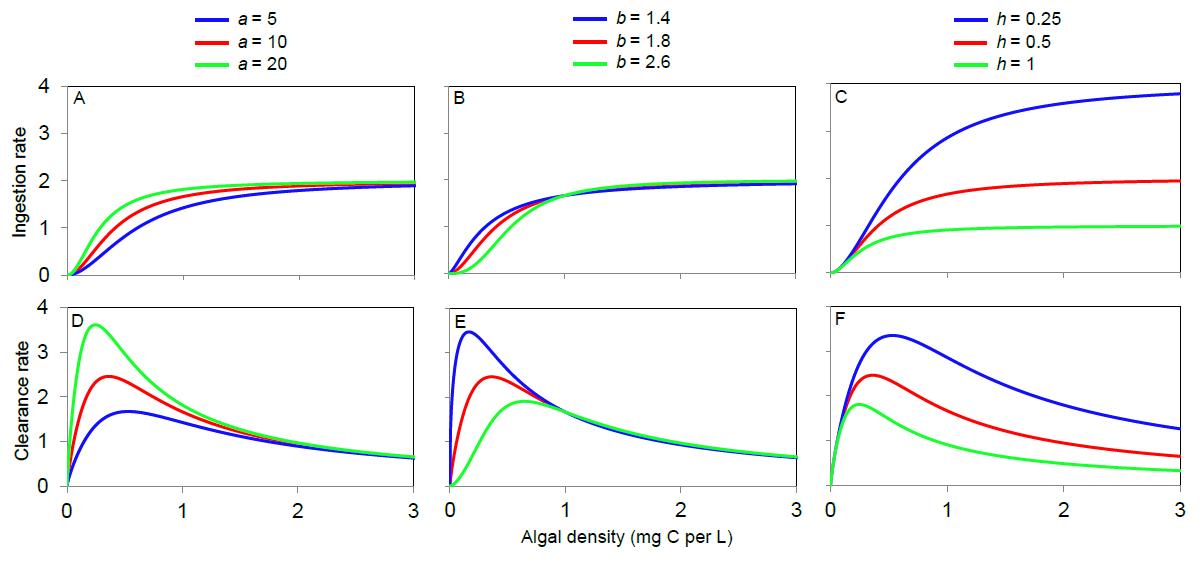
Fig. G3. Type III functional response curves plotted as ingestion rates (mg C per mg C of predator per d; panels A–C) and clearance rates (L per mg C of Daphnia per d; panels D–F). The default parameter values are: a=10, b=1.8 and h=0.5 (red lines). Blue and green lines illustrate the sensitivity of ingestion and clearance rates with respect to changes in the attack rate coefficient (a; A and D), functional response exponent (b; B and E) and handling time (h; C and F).