Ecological Archives E096-278-A1
Kayoko Fukumori, George Livingston, and Mathew A. Leibold. 2015. Disturbance-mediated colonizationextinction dynamics in experimental protist metacommunities. Ecology 96:32343242. http://dx.doi.org/10.1890/14-2487.1
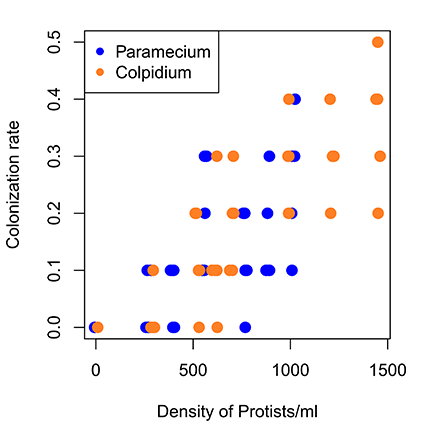
Appendix A. Relationship between population density and colonization rate of Paramecium and Colpidium.
Table A1. Mean (± 1 SE) comparison of variables measuring steady state and variation components among four treatments. P values from one-way ANOVAs are provided. Pairwise comparisons are based on posthoc Tukey’s HSD tests.
Variables |
N |
Mean |
SE |
ANOVA |
Comparison group* |
Post hoc P value |
|
|
|
|
|
No vs. Low |
0.007 |
|
|
|
|
|
No vs. Intermediate |
<0.001 |
Proportion of empty patches at week 9 |
20 |
0.33 |
0.06 |
F = 81.55 |
No vs. High |
<0.001 |
|
|
|
|
P < 0.001 |
Low vs. Intermediate |
0.007 |
|
|
|
|
|
Low vs. High |
<0.001 |
|
|
|
|
|
Intermediate vs. High |
<0.001 |
Steady state |
|
|
|
|
No vs. Low |
0.368
|
|
|
|
|
|
No vs. Intermediate |
0.005 |
G at week 9† |
20 |
0.84 |
0.03 |
F = 6.97 |
No vs. High |
<0.001 |
|
|
|
|
P < 0.001 |
Low vs. Intermediate |
0.294 |
|
|
|
|
|
Low vs. High |
0.055 |
|
|
|
|
|
Intermediate vs. High |
0.860 |
|
|
|
|
|
No vs. Low |
<0.001 |
|
|
|
|
|
No vs. Intermediate |
<0.001 |
X at week 9‡ |
20 |
0.78 |
0.03 |
F = 132.6 |
No vs. High |
<0.001 |
|
|
|
|
P < 0.001 |
Low vs. Intermediate |
<0.001 |
|
|
|
|
|
Low vs. High |
<0.001 |
|
|
|
|
|
Intermediate vs. High |
<0.001 |
Variation components |
|
|
|
|
No vs. Low |
<0.001 |
|
|
|
|
|
No vs. Intermediate |
<0.001 |
E|S during week 7 to 9 |
60 |
0.25 |
0.03 |
F = 32.12 |
No vs. High |
<0.001 |
|
|
|
|
P < 0.001 |
Low vs. Intermediate |
0.176 |
|
|
|
|
|
Low vs. High |
0.031 |
|
|
|
|
|
Intermediate vs. High |
0.871 |
|
|
|
|
|
No vs. Low |
0.117 |
|
|
|
|
|
No vs. Intermediate |
0.089 |
S|E during week 7 to 9 |
60 |
0.21 |
0.02 |
F = 11.55 |
No vs. High |
<0.001 |
|
|
|
|
P < 0.001 |
Low vs. Intermediate |
0.999 |
|
|
|
|
|
Low vs. High |
0.004 |
|
|
|
|
|
Intermediate vs. High |
0.006 |
|
|
|
|
|
No vs. Low |
0.999 |
|
|
|
|
|
No vs. Intermediate |
0.06 |
EwS during week 7 to 9 |
60 |
0.10 |
0.01 |
F = 8.223 |
No vs. High |
<0.001 |
|
|
|
|
P < 0.001 |
Low vs. Intermediate |
0.044 |
|
|
|
|
|
Low vs. High |
<0.001 |
|
|
|
|
|
Intermediate vs. High |
0.478 |
|
|
|
|
|
No vs. Low |
<0.001 |
|
|
|
|
|
No vs. Intermediate |
<0.001 |
Residuals during week 7 to 9 |
60 |
0.48 |
0.03 |
F = 29.27 |
No vs. High |
<0.001 |
|
|
|
|
P < 0.001 |
Low vs. Intermediate |
0.005 |
|
|
|
|
|
Low vs. High |
0.161 |
|
|
|
|
|
Intermediate vs. High |
0.496 |
*No, Low, Intermediate, and High shows No disturbance, Low disturbance, Intermediate disturbance, and High disturbance treatments, respectively.
†Proportion of non-empty patches that were dominated by the competitively superior species.
‡X=1/(1+Z)
Fig. A1. Relationship between population density and colonization rate of Paramecium (blue circle) and Colpidium (orange circle).