Ecological Archives E096-276-A1
Thomas F. Turner, Trevor J. Krabbenhoft, Michael L. Collyer, Corey A. Krabbenhoft, Melanie S. Edwards, and Zachary D. Sharp. 2015. Retrospective stable isotope analysis reveals ecosystem responses to river regulation over the last century. Ecology 96:32133226. http://dx.doi.org/10.1890/14-1666.1
Appendix A. Retrospective stable isotope analysis reveals ecosystem responses to river regulation over the last century. Analytical details for analysis of convex hull coverage (ACHC).
Analysis of convex hull coverage (ACHC) is a descriptive tool that measures the overlap of multiple groups across a uniform distribution of points in a data space, and summarizes the relative frequencies of the number of groups occurring at such points. ACHC has been used previously to discern unique morphotypes in morphospaces (e.g., Collyer et al. 2015). This study introduces ACHC as a tool for describing the probability of niche overlap in bivariate isotopic spaces. ACHC involves placing a uniform grid of many points over the bivariate space occupied by the entirety of samples (a convex hull of all values), and measures the number of “species” hulls that overlap each point. Other taxonomic units, guilds, or functional groups could also be used. From these many values, a relative frequency distribution is generated, which profiles the probability of finding 0, 1, …, k convex hulls, for the k species in the analysis. A resampling experiment is used to assign vectors of scores randomly to species and re-estimate the relative frequency distribution (probabilities) for convex hull numbers across the bivariate space, many times. This procedure produces sampling distributions of frequencies for a null model of non-differentiation of niches, from which inferences about observed patterns can be made.
If niches are undifferentiated, the probability of finding 0, 1, …, k convex hulls should be no different than expected by chance from a null model. Departures from expected probabilities can be evaluated. The individual relative frequencies, themselves, can be compared to (1 – α)100% confidence bands calculated from the sampling distributions of frequencies, for a type I error rate, α. A tendency for larger than expected probabilities of few hulls, plus smaller than expected probabilities for several hulls, for example, would be evidence of niche partitioning.
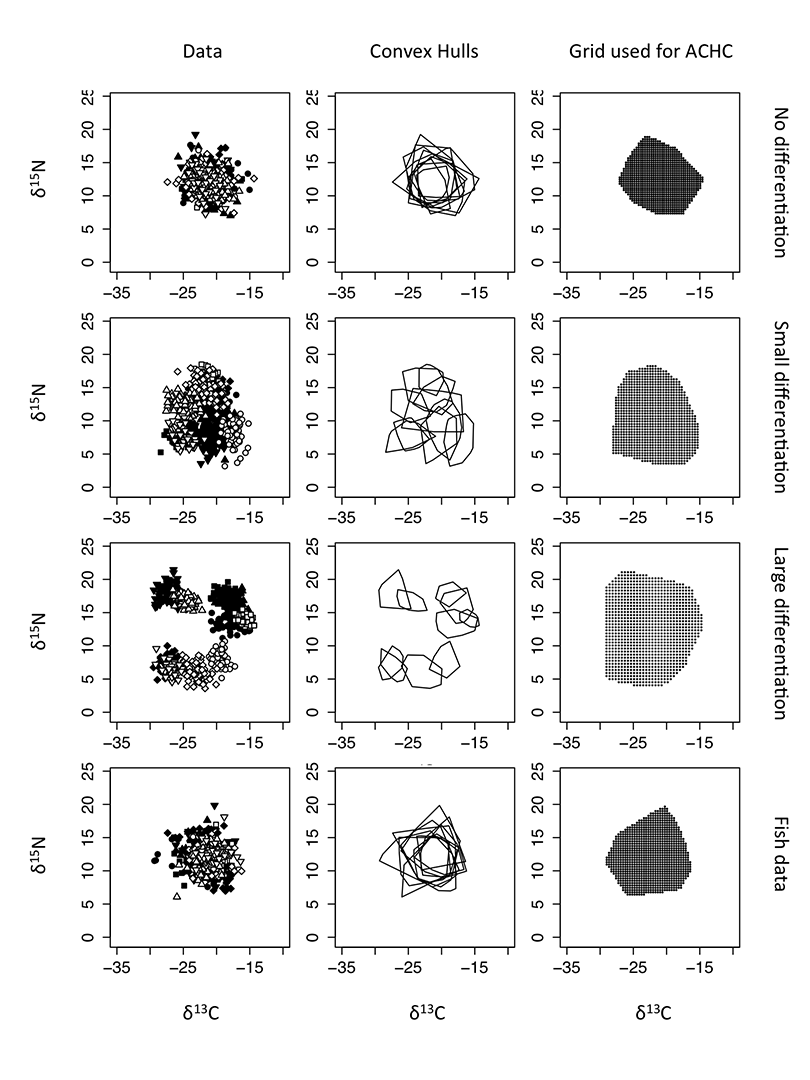
As an example of the inferential capacity of ACHC, we calculated covariance matrices for each species in the main article and simulated multivariate normal data matching the number of observations and the covariance structure of the isotopic variables, with no difference in species means (i.e., all species were centered at the centroid for all values). We introduced niche partitioning by applying a random uniform departure from this centroid for each species and a shrinking of variable variances, such that species became more separated and clustered. We performed this simulation with no differentiation, “small” differentiation, and “large” differentiation (Fig. A1). We used a uniform grid of ~ 1,000 points to cover the full representation of isotopic values in each case. (An algorithm is used to find the desired number of points; a solution might not find exactly 1,000 points). We performed 1,000 resampling permutations in each case, where vectors of isotopic values were randomly shuffled among species, and relative frequencies of convex hull overlap were recalculated (the observed scenarios counting as one random permutation). We used a value of α = 0.05 criterion for generating (95%) confidence bands.
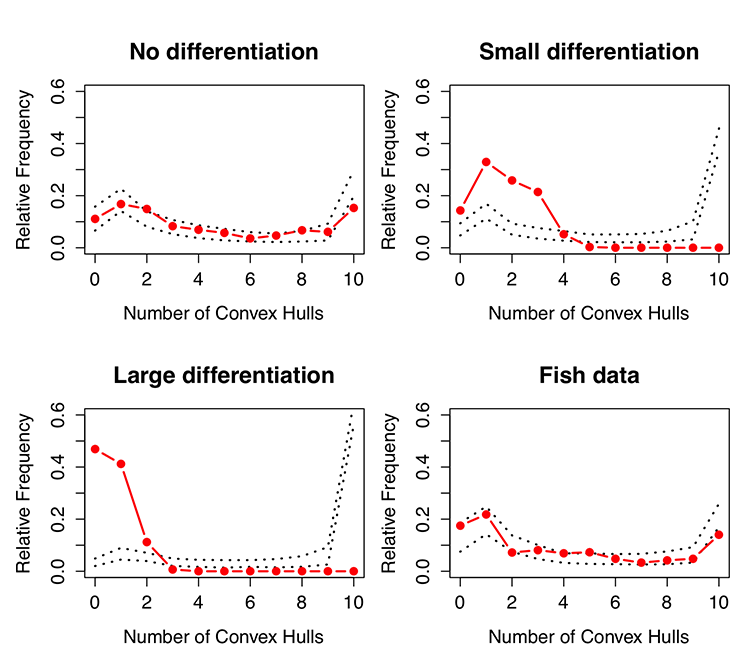
Confidence bands in each case tends to have a “U shape” across the spectrum of possible convex hull overlaps (Fig. A1). These shapes indicate two things: (1) a propensity in null models for the greatest frequency of overlapped hulls to equal the number of hulls and (2) a propensity for high frequencies of 0 or 1 hull found. The attributes indicate that a uniform grid applied to the data space will have a tendency to observe much overlap in the center of the plot and less overlap near the “edges” of a convex hull that describes the entire span of data, irrespective of species. Visual inspection of randomly generated hulls confirmed this phenomenon (results not shown). These patterns were found irrespective of niche partitioning, but greater partitioning reduced the “edge effects” and increased the propensity of overlap for the maximum number of hulls. Visual inspection of randomly generated hulls confirmed a positive association between convex hull area (CHA) and amount of differentiation, owing to greater sparseness of values in random hulls because of the space between observed hulls (results not shown).
When simulated species were not differentiated, the observed pattern tended to fall within the 95% confidence bands of the resampling experiment. As differentiation increased, the probability of observing fewer hulls overlapping increased, the probability of observing more hulls overlapping decreased, and the maximum number of hulls overlapping decreased (Fig. A2). In all regards, ACHC performed on the fish data from the main article indicate a lack of species differentiation in ecological niches.
ACHC is an analytical framework that needs further development for larger conceptual questions. It will be interesting to learn how useful ACHC is as a tool for evaluating niche overlap, despite variation in species number, sample sizes, covariance structures, grid density, and presence of outliers, and such research is ongoing. However, in terms of the three examples we simulated and qualitative comparisons with empirical data from the main article, results highlight that ACHC could be a valuable tool for assessing niche overlap to the extent that convex hulls describe niches. These analyses might be prone to spurious assessments if outliers greatly enhance convex hull area. Also, if the density of values within hulls is a concern, methods that define probabilistic niche overlap might be better suited for quantifying overlap than ACHC. Such a method was recently proposed by Swanson et al. (2015) and it can be extended to n-dimensional spaces. Their method similarly finds “credible” intervals for posterior probabilities of niche overlap, but focuses on pairwise species comparisons. Alternatively, ACHC measures overlap from the perspective of the data space, rather than species. Thus, ACHC is likely a tool that can compliment measurements of niche overlap assessed for species.
Fig. A1. Data used for ACHC analyses, their convex hulls, and resulting grids with ~1,000 points (Actual grid densities are 1002, 998, 1000, and 999 points, from top to bottom, respectively). The fish data are the same data from the main article (see the article for a description of pertinent symbols). For the purposes of these analyses, there are 10 species portrayed as either filled or open circles, squares, diamonds, upward triangles, and downward triangles).
Fig. A2. Relative frequency distributions for the number of overlapping convex hulls. Red lines and dots indicate observed trends. Dashed lines represent lower and upper 95% confidence bands, based on 1000 random permutations of isotope vectors assigned to species.
Literature Cited
Collyer, M. L., M. E. Hall, M. D. Smith, and C. W. Hoagstrom. 2015. Habitat-morphotype associations of Pecos pupfish (Cyprinodon pecosensis) in isolated habitat complexes. Copeia:181–199.
Swanson, H. K., M. Lysy, M. Power, A. D. Stasko, J. D. Johnson, and J. D. Reist. 2015. A new probabilistic method for quantifying n-dimensional ecological niches and niche overlap. Ecology 96:318–324.