Ecological Archives E096-275-A1
Carly D. Kenkel, Albert T. Almanza, and Mikhail V. Matz. 2015. Fine-scale environmental specialization of reef-building corals might be limiting reef recovery in the Florida Keys. Ecology 96:31973212. http://dx.doi.org/10.1890/14-2297.1
Appendix A. Additional tables and figures.
Table A1. Initial sample sizes at the beginning of the transplant experiment and how many of those samples were recovered at the six-month and one-year time point by site. No mortality was observed, rather, environmental disturbances such as Hurricane Issac resulted in the loss of samples.
Region |
Transplant Site* |
Origin |
Initial N‡ |
N collected at Six Months§ |
N collected at One Year |
Total N Lost |
Lower Keys |
Inshore |
Inshore |
30 |
15 |
15 |
0 |
Lower Keys |
Inshore |
Offshore |
30 |
15 |
15 |
0 |
Lower Keys |
Offshore |
Inshore |
30 |
15 |
12 |
3 |
Lower Keys |
Offshore |
Offshore |
30 |
15 |
12 |
3 |
Lower Keys |
In-novel |
Inshore |
30 |
15 |
13 |
2 |
Lower Keys |
Off-novel |
Offshore |
30 |
15 |
14 |
1 |
Middle Keys |
Inshore |
Inshore |
30 |
13 |
13 |
4 |
Middle Keys |
Inshore |
Offshore |
30 |
15 |
10 |
5 |
Middle Keys |
Offshore |
Inshore |
30 |
5 |
6 |
19 |
Middle Keys |
Offshore |
Offshore |
30 |
10 |
5 |
15 |
Middle Keys |
In-novel |
Inshore |
30 |
13 |
5 |
12 |
Middle Keys |
Off-novel |
Offshore |
30 |
13 |
12 |
5 |
* See Materials & Methods: Experimental Design for site names and coordinates.
‡ Two fragments per genotype per transplant site, N = 15 unique genotypes from each source population.
§ One fragment per genotype was targeted for collection at each sampling time (six months and one year).
Table A2. Wald test statistics for individual factors and interaction terms for the best-fit model for percent weight gain.
Factor |
numDF |
denDF |
F value |
P value |
(Intercept) |
1 |
211 |
792.4 |
0.000 |
Origin |
1 |
56 |
10.4 |
0.002 |
Destination |
2 |
211 |
40.7 |
0.000 |
Region |
1 |
56 |
11.3 |
0.001 |
Time |
1 |
211 |
182.0 |
0.000 |
Origin × Destination |
2 |
211 |
15.7 |
0.000 |
Origin × Region |
1 |
56 |
11.8 |
0.001 |
Destination × Region |
2 |
211 |
2.9 |
0.057 |
Origin × Time |
1 |
211 |
1.8 |
0.183 |
Destination × Time |
2 |
211 |
3.5 |
0.031 |
Region × Time |
1 |
211 |
0.3 |
0.596 |
Origin × Destination × Region |
2 |
211 |
6.4 |
0.0019 |
Origin × Destination × Time |
2 |
211 |
3.9 |
0.022 |
Origin × Region × Time |
1 |
211 |
3.4 |
0.067 |
Destination × Region × Time |
2 |
211 |
1.0 |
0.383 |
Origin × Destination × Region × Time |
2 |
211 |
17.5 |
0.000 |
Table A3. Wald test statistics for individual factors and interaction terms for the best-fit model for total protein (mg/cm²).
Factor |
numDF |
denDF |
F value |
P value |
(Intercept) |
1 |
219 |
950.2 |
0.000 |
Origin |
1 |
56 |
0.7 |
0.421 |
Destination |
2 |
219 |
2.9 |
0.055 |
Region |
1 |
56 |
0.1 |
0.700 |
Time |
1 |
219 |
84.9 |
0.000 |
Origin × Destination |
2 |
219 |
0.9 |
0.396 |
Origin × Region |
1 |
56 |
1.6 |
0.208 |
Destination × Region |
2 |
219 |
1.0 |
0.369 |
Origin × Time |
1 |
219 |
6.8 |
0.009 |
Region × Time |
1 |
219 |
69.6 |
0.000 |
Origin × Destination × Region |
2 |
219 |
2.5 |
0.083 |
Table A4. Wald test statistics for individual factors and interaction terms for total carbohydrate (mg/cm²).
Factor |
numDF |
denDF |
F value |
P value |
(Intercept) |
1 |
221 |
813.4 |
0.000 |
Origin |
1 |
56 |
0.3 |
0.589 |
Destination |
2 |
221 |
2.7 |
0.066 |
Region |
1 |
56 |
1.3 |
0.260 |
Time |
1 |
221 |
0.003 |
0.956 |
Origin × Region |
1 |
56 |
3.2 |
0.078 |
Destination × Region |
2 |
221 |
1.9 |
0.157 |
Origin × Time |
1 |
221 |
5.0 |
0.026 |
Destination × Time |
2 |
221 |
1.6 |
0.201 |
Region × Time |
1 |
221 |
7.2 |
0.008 |
Table A5. Wald test statistics for individual factors and interaction terms for total lipid (mg/cm²). It is important to note lipids were only measured for the lower keys “cross-channel” samples at the one year time point.
Factor |
numDF |
denDF |
F value |
P value |
(Intercept) |
1 |
28 |
934.9 |
0.000 |
Origin |
1 |
28 |
0.09 |
0.767 |
Destination |
1 |
20 |
7.8 |
0.011 |
Origin × Destination |
1 |
20 |
2.0 |
0.168 |
Table A6. Wald test statistics for individual factors and interaction terms for symbiont density (cells/cm²).
Factor |
numDF |
denDF |
F value |
P value |
(Intercept) |
1 |
212 |
2658.2 |
0.000 |
Origin |
1 |
56 |
0.8 |
0.372 |
Destination |
2 |
212 |
0.7 |
0.521 |
Region |
1 |
56 |
2.3 |
0.137 |
Time |
1 |
212 |
0.6 |
0.440 |
Origin × Destination |
2 |
212 |
7.4 |
0.001 |
Origin × Region |
1 |
56 |
2.5 |
0.118 |
Destination × Region |
2 |
212 |
4.8 |
0.009 |
Origin × Time |
1 |
212 |
12 |
0.001 |
Destination × Time |
2 |
212 |
1.2 |
0.309 |
Region × Time |
1 |
212 |
28.5 |
0.000 |
Origin × Destination × Region |
2 |
212 |
5.9 |
0.003 |
Origin × Destination × Time |
2 |
212 |
8.2 |
0.000 |
Origin × Region × Time |
1 |
212 |
2.3 |
0.129 |
Destination × Region × Time |
2 |
212 |
1.6 |
0.202 |
Table A7. Wald test statistics for individual factors and interaction terms for the best-fit model for Chlorophyll a (ng/cm²).
Factor |
numDF |
denDF |
F value |
P value |
(Intercept) |
1 |
187 |
561.4 |
0.000 |
Origin |
1 |
56 |
0.3 |
0.567 |
Destination |
2 |
187 |
0.07 |
0.929 |
Region |
1 |
56 |
5.3 |
0.025 |
Time |
1 |
187 |
40.6 |
0.000 |
Origin × Destination |
2 |
187 |
0.2 |
0.784 |
Origin × Region |
1 |
56 |
0.5 |
0.492 |
Destination × Region |
2 |
187 |
0.3 |
0.754 |
Origin × Time |
1 |
187 |
2.1 |
0.153 |
Destination × Time |
2 |
187 |
0.8 |
0.454 |
Region × Time |
1 |
187 |
4.3 |
0.039 |
Origin × Destination × Region |
2 |
187 |
0.2 |
0.792 |
Origin × Destination × Time |
2 |
187 |
1.0 |
0.360 |
Origin × Region × Time |
1 |
187 |
1.4 |
0.237 |
Destination × Region × Time |
2 |
187 |
2.7 |
0.073 |
Origin × Destination × Region × Time |
2 |
211 |
2.1 |
0.125 |
Table A8. Wald test statistics for individual factors and interaction terms for the best-fit model for Chlorophyll c2 (ng/cm²).
Factor |
numDF |
denDF |
F value |
P value |
(Intercept) |
1 |
190 |
641.5 |
0.000 |
Origin |
1 |
56 |
1.4 |
0.248 |
Destination |
2 |
190 |
0.6 |
0.573 |
Region |
1 |
56 |
2.6 |
0.114 |
Time |
1 |
190 |
122 |
0.000 |
Origin × Destination |
2 |
190 |
2.0 |
0.133 |
Origin × Region |
1 |
56 |
0.7 |
0.403 |
Destination × Region |
2 |
190 |
1.3 |
0.267 |
Origin × Time |
1 |
190 |
1.9 |
0.166 |
Destination × Time |
2 |
190 |
0.6 |
0.568 |
Region × Time |
1 |
190 |
18.9 |
0.000 |
Origin × Destination × Region |
2 |
190 |
2.8 |
0.063 |
Origin × Destination × Time |
2 |
190 |
2.0 |
0.137 |
Destination × Region × Time |
2 |
190 |
1.7 |
0.179 |
Table A9. AICc model selection results for relationships among energetic parameters and percent weight gain.
Factor |
K |
AICc |
ΔAICc |
AICc Wt |
Cum. Wt |
LL |
Protein + Symbiont Density |
5 |
-681.98 |
0.00 |
0.68 |
0.68 |
346.09 |
Protein |
4 |
-680.43 |
1.54 |
0.32 |
1.00 |
344.29 |
Symbiont Density |
4 |
-644.14 |
37.83 |
0.00 |
1.00 |
326.14 |
null |
3 |
-641.82 |
40.15 |
0.00 |
1.00 |
323.95 |
Carbohydrate |
4 |
-638.42 |
43.55 |
0.00 |
1.00 |
323.28 |
Chlorophyll c2 |
4 |
-618.81 |
63.17 |
0.00 |
1.00 |
313.48 |
Chlorophyll A |
4 |
-588.09 |
93.88 |
0.00 |
1.00 |
298.12 |
Lipid |
4 |
-190.53 |
491.45 |
0.00 |
1.00 |
99.69 |
Protein + Lipid + Symbiont Density |
6 |
-189.71 |
492.27 |
0.00 |
1.00 |
101.79 |
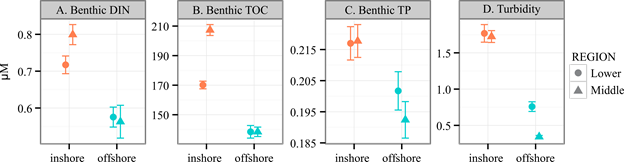
Fig. A1. Inshore and offshore reefs in the Florida Keys exhibit differences in water quality and temperature. Mean ± SE for measures of (A) Benthic dissolved inorganic nitrogen (DIN), (B) total organic carbon (TOC), (C) total phosphorous (TP) and (D) turbidity (in NTU) from 1995–2011, provided by the SERC-FIU Water Quality Monitoring Network which is supported by EPA Agreement #X994621-94-0 and NOAA Agreement #NA09NOS4260253.
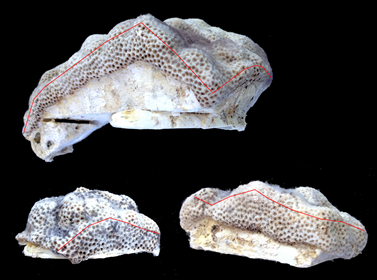
Fig. A2. Coral fragment skeletons at the completion of the experiment showing coral growth over the initial cut margins. Red line indicates original cut margin.
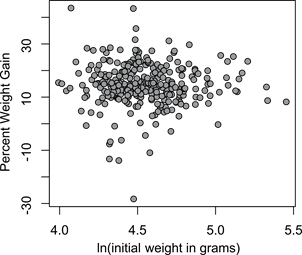
Fig. A3. Percent weight gain is independent of initial fragment size.
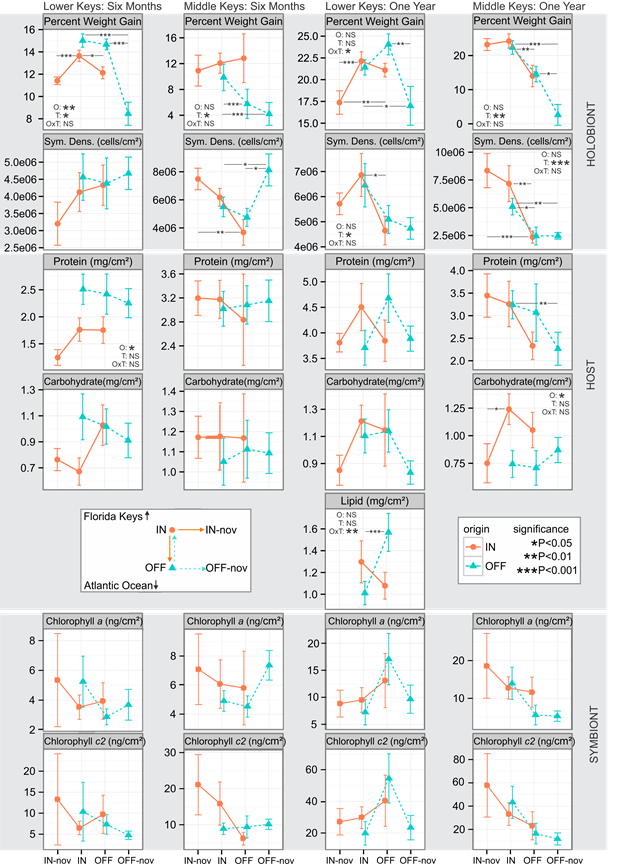
Fig. A4. Mean phenotypic trait values ± SE of corals at each site and time point. Significance of post-hoc pair-wise comparisons are derived from MCMCglmm models. O: effect of population origin; T: effect of transplant destination, OxT: effect of the origin by transplant interaction.
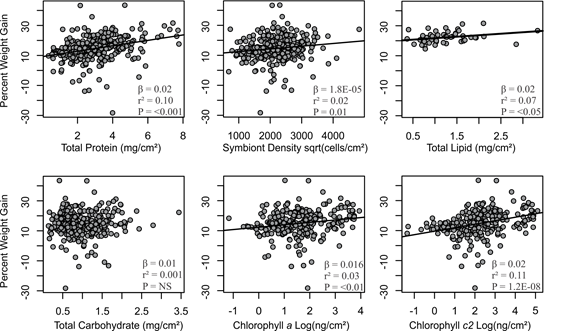
Fig. A5. Linear models incorporating (A) total protein (n = 290) and (B) symbiont density (n = 290) were the only ones to show AICc values that indicated an improvement over the null model. Both trait measurements show significant positive correlations with percent weight gain. Additional correlations between phenotypic trait data and percent growth indicate weak positive relationships overall.
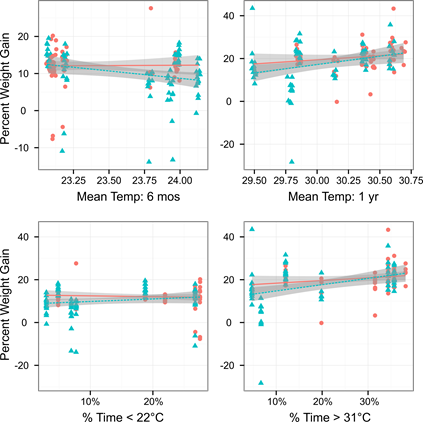
Fig. A6. Mean temperature or threshold temperatures do not explain a significant proportion of the variation in weight gain among coral fragments transplanted to different reef sites.