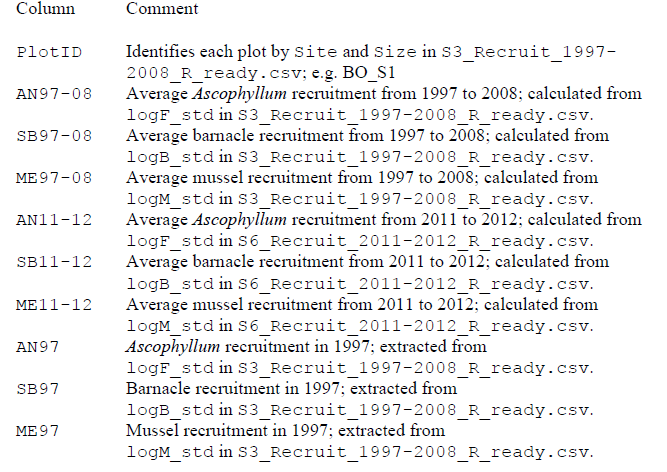
Jmp Pro 10 was used to calculate the correlations between recruitment in 1997 and the 2011–2012 averages and between the 1997–2008 averages and the 2011–2012 averages. Data can be found in S5_Correlation_data.csv. Data for calculation of averages were extracted from files S3_Recruit_1997-2008_R_ready.csv (see Supplement 3) and S6_Recruit_2011-2012_R_ready.csv (see Supplement 6). Missing data are denoted with a period. The columns of S5_Correlation_data.csv are:
S5_Mantel_Gower.R is the R code for the Mantel tests that tested the concordance in recruitment in individual plots before and after scraping. First, the FD package was used to calculate Gower’s dissimilarities, which handle missing data and standardizes by column. Mantel tests were run using the vegan package. We also checked for concordance between species by comparing mussels versus barnacles, mussels versus rockweeds, and barnacles versus rockweeds.
There are six data files; file names include an identifier for species (AN=Ascophyllum, ME=mussels, SB=barnacles), and if the data are from pre or post scraping. For example, data file for mussel recruitment prior to scraping is named S5_MEpreG.csv. The “pre-scraped” data files were extracted from S3_Recruit_1997-2008_R_ready.csv (see Supplement 3) and the “post-scraped data files were extracted from S6_Recruit_2011-2012_R_ready.csv (see Supplement 6). Data files do not include a column with plot ID; header row identifies Year, e.g., Y1997, Y1998, etc.
There are missing data, which is why Gower dissimilarities were used. For the pre-scraped data, some years are missing entirely, and there are a few missing observations in other years. Post data files have data from 2001 and 2012 for 60 plots (n = 120 possible entries).
S5_ANpreG.csv is missing data for 1999 and 2004, thus has a possible 600 entries (10 years × 60 plots). Total missing entries = 16/600.
S5_MEpreG.csv is missing data for 1999 and has 660 possible entries. Total missing entries = 26/660.
S5_SBpreG.csv is missing data for 1998 and 2002, and has 600 possible entries. Total missing entries = 31/600.
S5_ANpostG.csv is missing 3/120 entries.
S5_MEpostG.csv is missing 0/120 entries.
S5_SBpostG.csv is missing = 4/120 entries.