Ecological Archives E096-269-D1
Nathan P. Myhrvold, Elita Baldridge, Benjamin Chan, Dhileep Sivam, Daniel L. Freeman, and S. K. Morgan Ernest. 2015. An amniote life-history database to perform comparative analyses with birds, mammals, and reptiles. Ecology 96:3109. http://dx.doi.org/10.1890/15-0846.1
Metadata
Class I. Data set descriptors
A. Data set identity: An amniote life history database to perform comparative analyses with birds, mammals, and reptiles.
B. Data set identification code:
Amniote_Database_Aug_2015.csv
Amniote_References_Aug_2015.csv
Amniote_Sparse_Table_Aug_2015.csv
Amniote_Range_Count_Aug_2015.csv
C. Data set description
Individual data records were gathered from a variety of sources, including primary literature, existing databases, books, and other compilations (a complete list is shown in Supplemental Table 1). Our data are presented in the following comma separated value (CSV) files:
Amniote_Database_Aug_2015.csv: This file contains the median values for each parameter for each species. This file is considered the final database output of the project. The values presented in this table are median and interpolated median values derived (discussed in detail in the Methods section) from the raw data aggregated in the file Amniote_Sparse_Table_Aug_2015.csv.
Amniote_References_Aug_2015.csv: A duplicate database CSV file provides a key to the references underlying each data point reported in the file Amniote_Database_Aug_2015.csv. Most reported values are the median of multiple underlying values—this table describes which sources were used to obtain the median, as well as which source (or sources in the case of an even number of underlying values) was the actual median value.
Amniote_Sparse_Table_Aug_2015.csv: Contains one row (with a reference) for every raw data point we used to construct the file Amniote_Database_Aug_2015.csv.
Amniote_Range_Count_Aug_2015.csv: Lists the minimum value and the maximum value for each parameter, as well as the number of data sources used to determine the median value for each parameter reported in the file Amniote_Database_Aug_2015.csv.
Principle Investigators: Nathan P. Myhrvold, Intellectual Ventures, Bellevue, WA 98005; Elita Baldridge, Department of Biology and the Ecology Center, Utah State University, Logan, UT 84322; Benjamin Chan, Intellectual Ventures, Bellevue, WA 98005; Dhileep Sivam, Intellectual Ventures, Bellevue, WA 98005; Daniel L. Freeman, Intellectual Ventures, Bellevue, WA 98005; S.K. Morgan Ernest, Department of Biology and the Ecology Center, Utah State University, Logan, UT 84322 & Department of Wildlife Ecology and Conservation, University of Florida, Gainesville, Florida 32611
Abstract: Studying life-history traits within and across taxonomic classifications has revealed many interesting and important patterns, but this approach to life history requires access to large compilations of data containing many different life-history parameters. Currently, life-history data for amniotes (birds, mammals, and reptiles) is split among a variety of publicly available databases, data tables embedded in individual papers and books, and species-specific studies by experts. Using data from this wide range of sources is a challenge for conducting macroecological studies because of a lack of standardization in taxonomic classifications, parameter values, and even in which parameters are reported. In order to facilitate comparative analyses between amniote life-history data, we created a database compiled from peer-reviewed studies on individual species, macroecological studies of multiple species, existing life-history databases, and other aggregated sources as well as published books and other compilations. First, we extracted and aggregated the raw data from the aforementioned sources. Next, we resolved spelling errors and other formatting inconsistencies in species names through a number of computational and manual methods. Once this was completed, subspecies-level data and species-level data were shared via a data-sharing algorithm to accommodate the variety of species transformations (taxonomic promotions, demotions, merges, divergences, etc.) that have occurred over time. Finally, in species where multiple raw data points were identified for a given parameter, we report the median value. Here, we report a normalized and consolidated database of up to 29 life-history parameters, containing at least one life-history parameter for 21 322 species of birds, mammals, and reptiles.
D. Key words: amniote; birds; body size; comparative analyses; database; life history; macroecology; mammals; reptiles.
Class II. Research origin descriptors
A. Overall project description
Identity: An amniote life history database to perform comparative analyses with birds, mammals, and reptiles
Originators: Nathan P. Myhrvold, Intellectual Ventures, Bellevue, WA 98005; Elita Baldridge, Department of Biology and the Ecology Center, Utah State University, Logan, UT 84322; Benjamin Chan, Intellectual Ventures, Bellevue, WA 98005; Dhileep Sivam, Intellectual Ventures, Bellevue, WA 98005; Daniel L. Freeman, Intellectual Ventures, Bellevue, WA 98005; S.K. Morgan Ernest, Department of Biology and the Ecology Center, Utah State University, Logan, UT 84322
Period of Study: Not Applicable
Sources of funding: The researchers received no external funding for this work.
B. Research Motivation
Many important macroecological trends have been identified and explained by comparing life history parameters among and/or within genetically, geographically, or temporally distinct groups of animals (Ricklefs 1968, Promislow and Harvey 1990, Meiri et al. 2011). To improve trend resolution and to identify increasingly complex traits, these studies require access to an increasingly large set of species-specific life history parameters. While many researchers have developed and published databases that focus on a specific subset of animals, such as by classification, trophic level, habitat, ecology or species characteristics (de Magalhães and Costa 2009, Jones et al. 2009, Thorson et al. 2013), there are currently very few databases that both allow a facile comparison between multiple vertebrate classes and are easily accessible. Furthermore, comparisons between existing databases, even within the same class of animals, is often challenging because of a lack of consistency in the choice of which life history parameters are reported, and even in the way individual parameters are formatted and presented; this makes large, comparative studies particularly challenging. Comparative approaches—where data is examined across large numbers of species—have proved to be a powerful way to explore the evolution of traits (Pagel 1999), test general theories (Charnov and Ernest 2006), and examine traits linked with current extinction risks (Cardillo et al. 2005).
Our goal was to collect and develop a broad set of consistently formatted life history parameters for amniotes that allows researchers to explore patterns of life history traits within and among birds, mammals, and reptiles. We present a collection of 29 common life history parameters compiled from peer-reviewed studies on individual species, macroecological studies of multiple species, existing life history databases, and other aggregated sources as well as published books and other compilations. Making these data more accessible to researchers will help facilitate the study of life history traits across classes.
While a database of life history parameters for all vertebrates would serve the research community, an amniote-specific database is extremely useful as a standalone project because amniotes form a monophyletic group with very similar life cycles (i.e., no distinct aquatic phase); therefore, they are a straightforward and diverse group for cross-taxa comparisons of life history. Furthermore, the amniote clade is of particular interest to researchers reconstructing the ecology and life history of ancestral forms of birds, mammals, and extinct lineages such as non-avian dinosaurs (O’Leary et al. 2013, Green et al. 2014). We are making all of our raw and processed data publicly available to ensure that any interested researchers can readily expand the scope to other vertebrates.
In total, we collected raw data records for 47,527 birds, 24,253 mammals, and 27,704 reptiles, for a total of 99,311 records, containing 194,500 total data points. Supplemental Table 2 lists the number of data points drawn from each of our sources. 56.9% of the data points come from the 10 largest data sources. The remaining 43.1% are from approximately 1,000 smaller data sources. Additionally, many of the data sources, both large and small, were in print or electronic resources that were not freely or readily available. Furthermore, there were a wide variety of data formats across the various resources, thus requiring significant work to merge them into a unified database.
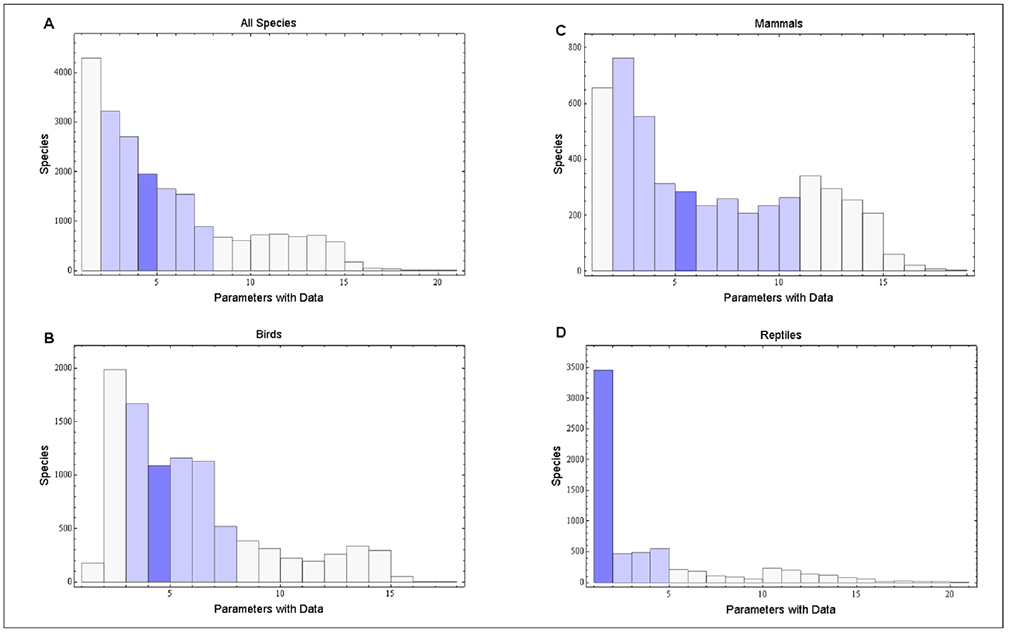
Globally, there are an estimated 12,934 bird, 5,419 mammal, and 9,952 reptile species. Our database includes data for at least one life history parameter for 9,802 bird, 4,953 mammal, and 6,567 reptile species (Table 1). Across all species, the median number of parameters reported for a given species is four, with 50% of the species having data on between two and seven life history parameters (Figure 1).
In species where multiple raw data points were identified for a given parameter, we report the median value (for a more detailed discussion, see Methods). Approximately 50% of all reported parameters are derived from two or more raw data points (Table 2). Approximately 10% of all reported parameters are derived from five or more raw data points.
Table 1. Database summary statistics.
Class
|
Known Species
|
Raw Records
|
Species with at least one data point
|
Species with Complete Basic Data
|
Species with Complete Extended Data
|
Aves
|
12,934
|
47,527
|
9,802
|
1,028
|
580
|
Mammalia
|
5,419
|
24,253
|
4,953
|
1,548
|
764
|
Reptilia
|
9,952
|
27,704
|
6,567
|
194
|
77
|
Fig. 1. Histograms of the number of reported life history parameters for each species in the aggregated database (A), and Birds (B), Mammals (C), and Reptiles (D) separately. The light blue shading represents the range of the 25th to 75th quartile of reported parameters for each species. In aggregate, between two and seven life history parameters are reported for 50% of the species in the database. The dark blue bin is the median number of parameters reported.
Table 2. The number of raw records merged for each reported parameter value for Birds, Mammals, and Reptiles. Approximately 50% of all reported parameters are derived from the median of two or more raw data points. Approximately 10% of all reported parameters are derived from the median of five or more data points.
Number of sources |
Birds |
Mammal |
Reptiles |
>=1 |
100% |
100% |
100% |
>=2 |
60.3% |
66.0% |
42.8% |
>=3 |
33.5% |
41.2% |
22.6% |
>=4 |
19.6% |
22.5% |
14.4% |
>=5 |
11.8% |
14.4% |
10.1% |
>=10 |
1.2% |
2.0% |
3.1% |
>=15 |
0.15% |
0.71% |
1.38% |
>=20 |
0.02% |
0.32% |
0.64% |
Furthermore, we divided the data into basic and extended parameter groups. The basic data group includes the parameters suitable for studying population and growth traits across all species: Female Maturity (d), Litter/Clutch Size (#), Litters/Clutches Per Year (#/y), Adult Body Mass (g), and Maximum Longevity (y). Our database includes complete basic data on 1,028 bird, 1,548 mammal, and 194 reptile species (Figure 2). The extended parameter group includes all basic parameters plus several additional parameters useful for studying more focused or complex traits. The parameters included in the extended data group vary by class. For mammals we have included Gestation (d), Weaning (d), Birth/Hatching Weight (g), and Weaning Weight (g). For birds and reptiles, our extended data set includes Birth/Hatching Weight (g), Egg Mass (g), Incubation (d), and, for birds only, Fledging Age (d). Our database includes complete extended data for 580 bird, 764 mammal, and 77 reptile species.
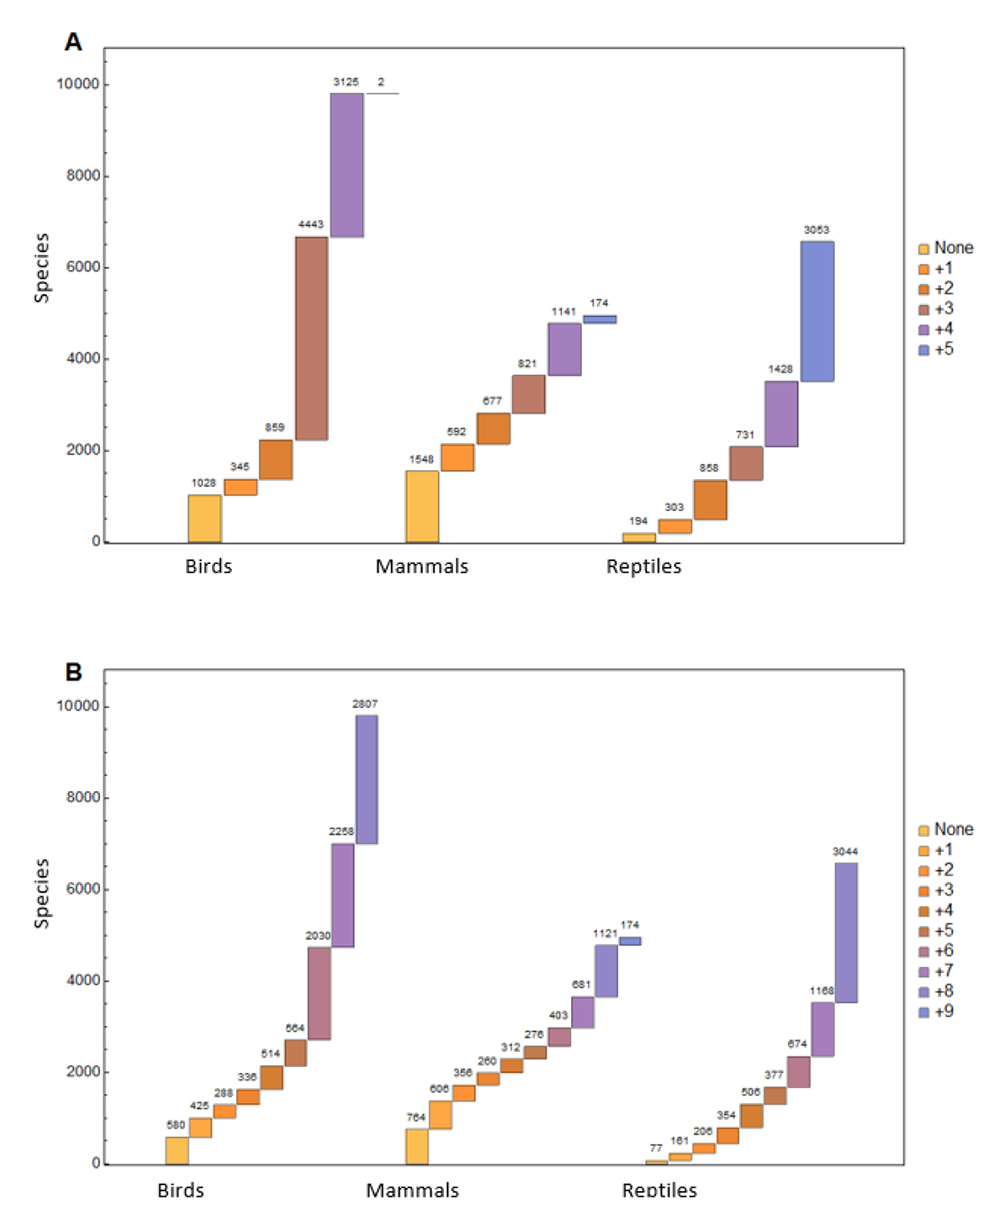
Fig. 2. Missing parameter counts for each species of Bird, Mammal, and Reptile, showing how many additional parameters are needed to complete the basic and extended data groups. Note that the extended data group for reptiles only includes eight parameters, whereas the extended data groups in Birds and Mammals both include nine parameters. The database reflects complete basic data for 1,028 bird, 1,548 mammal, and 194 reptile species and complete extended data for 580 bird,764 mammal, and 77 reptile species.
Raw data were assembled from a wide variety of sources, including peer-reviewed journal articles, published books and compilations, and previously published databases. In cases where a mean, median, or range was reported, we captured the mean, median, and/or high/low range values as individual data points for the particular species. Each raw data point was imported into Mathematica (v9.0.1) and converted to a consistent set of units for each parameter. Raw data points were imported into the database under the taxonomic structure that was reported with the value in the original data source.
A major challenge to collecting and aggregating data across a wide variety of species is that of resolving temporal changes in taxonomy between when the raw data point was originally recorded and the currently accepted classification, as well as to resolve spelling errors and other formatting inconsistencies. To resolve these changes, errors, and inconsistencies, we employed a variety of string processing methodologies. First, we used the 2014 IOC World Bird List (v4.1), Mammal Species of the World (2005), and The Reptile Database (April, 2014), to identify the most current taxonomic assignments for Birds, Mammals, and Reptiles, respectively (Wilson and Reeder 2005, Gill and Donsker 2014, Uetz and Hosek 2014). Next, we assembled master synonym lists for each class by gathering old and current synonyms from the above sources, as well as from NCBI, A World Checklist of Birds, eBird Taxonomy (v1.051b), Mammal Planet, and the taxonomic conversion file from PanTHERIA(“Classification of Mammals: Notions of taxonomy” n.d., “The NCBI ftp site: Taxonomy” n.d., Monroe and Sibley 1997, Sullivan et al. 2009, Jones et al. 2009). Names for which we found raw data, but that did not map to an old or current synonym or taxonomy, were computationally checked for potential matches to synonyms or currently accepted taxonomies. Potential matches were manually verified and added to a synonym list for each class. All names that could not be resolved computationally were then checked by hand for potential spelling errors and/or to identify the current taxonomic assignment. Correct transformations of these names were then added to the synonym lists.
Using the synonym lists described above, we mapped the species names from our raw data sources (updated to rectify any identified spelling or formatting errors) to the currently accepted taxonomy. In total, we identified name transformation mappings for 19,602 birds, 33,030 mammals, and 24,825 reptiles (Supplemental Tables 3-5).
For any particular species, our raw data pool contained a mix of data at the species and subspecies levels. To accommodate the variety of taxonomic merges, divergences, promotions, demotions, and many other species transformations over time, we developed a data sharing strategy that reflects all subspecies data at the species level and then assigns the species level data to all past and presently known subspecies. This ensures that any data captured at the species level are reflected at the subspecies level and vice versa.
Furthermore, since the original name assigned to each raw data point reflects the taxonomy in use at the time the data point was collected, by sharing data across original names and then applying the name transformation rules described above, a subspecies that later becomes its own species or merges with another species will inherit any data assigned to the old subspecies as well as any data assigned to the new species. We repeat this process of reflecting all subspecies data at the species level and then reassigning species level data to all subspecies up to ten times for each class. This forward-only inheritance process allows any data captured prior to any name transformation to follow a species or subspecies through any number of promotions, merges, or other name transformations that happen across time, while remaining consistent with the best available taxonomic information at the time each raw data point was collected. A detailed list of every data-sharing event (59,670 for Aves, 38,454 for Mammalia, and 41,703 for Reptilia) is presented in Supplemental Tables 6-8. Following these tables will allow a user to trace any data found in the final data file back to its original source.
Once the data were shared and inherited across all species and subspecies transformations, the raw data pool was then merged together to create a single row entry for each species with a single value reported for each parameter. For parameters with multiple raw data points, we report the median value if there is an odd number of raw data points, and the mean of the middle two data points (technically, the interpolated median) if there is an even number of raw data points. We report the median, rather than the mean, in order to make the reported values as robust as possible against erroneous raw data points.
For the parameter “Maximum Longevity” we chose to report the maximum value that we found in the literature, rather than the median, because we felt that value would be of more interest to the user. A user interested in determining the median of the reported longevity data for a particular species can do so by consulting the file Amniote_Sparse_Table_Aug_2015.csv.
In some cases a single data source may report the identical value for a single parameter multiple times. This may happen, for instance, if a data source is reporting values obtained from multiple earlier data sources, both of which report the same values. In those cases we chose to only include the value once when determining the median value, so as to prevent a single data source from overly influencing the median parameter values. For the sake of completeness, we do report the multiple reported identical values in the file Amniote_Sparse_Table_Aug_2015.csv, they are reflected in that file as identical data rows with the same reference. However, only one instance of such duplicate values is counted when reporting, in the file Amniote_Range_Count_Aug_2015.csv, the number of data sources used to determine a particular parameter, as this table reflects only the values used to determine the final median values.
We developed a two-tiered data validation process to identify and validate or purge potentially erroneous raw data points from our data.
First, after assembling the raw data pool, for each species and parameter for which we had assembled more than one raw data point, we flagged all species-parameter combinations for which the ratio of the maximum to minimum raw data point values was greater than five. The five-to-one ratio holds no specific biological significance, however given the volume of data in the project, we used this heuristic to help us identify outlying data that warranted further scrutiny. For these potentially internally inconsistent combinations, the flagged species-parameter combinations were exported, along with every underlying raw data point for further investigation. Flagged data values were hand checked for validity and either confirmed or purged from the database.
Next, for each class, we performed regressions on a variety of life history parameter combinations. In each regression, we identified any values above or below four orders of magnitude of the mean and hand checked every raw data point composing both the independent and dependent variables. For mammals, it was helpful to further divide the class into the following categories for the regressions: all mammals, bats, no bats, terrestrial mammals, aquatic mammals, aquatic mammals without whales, and whales. In some cases, we also regressed marsupial and placental mammals separately.
In total, we regressed lifespan, age-of-reproduction or sexual maturity (female maturity/maximum longevity), weaning mass, parental investment (Litter/Clutch Size x Litters/Clutches Per Year x Birth/Hatching Weight), birth/hatching weight, and litters/clutches per year versus adult body mass, as well as male versus female body mass, male versus female maturity, and weaning weight versus birth/hatching weight. Additionally, we regressed fledging mass versus adult body mass, fledging mass versus birth/hatching mass, fledging age versus gestation, fledging age versus incubation, and fledge mass versus egg mass for birds.
We recognize that the aggregation of multiple raw data sources, particularly aggregated sources such as books, compilations, or other databases, could result in multiple instances of the same original raw data point being included in the data pool, thereby skewing the final reported value for a given parameter. On the one hand, a single original data point propagated across multiple sources could suggest the larger research community’s verification of the validity of the data point, and thus each reproduction should be included as a separate value in our data pool. On the other hand, a parameter that is particularly hard to capture may simply be propagated throughout the literature due to lack of a better alternative. In this case, we would only want to include a single record for the value in our data pool. Since we have no way to tell which case applies to which raw data points, to quantify the number of redundant raw data points in our data pool and to investigate their effect on the final merged parameter values, we compared the merged results of our database with the merged results after deleting all redundant data points, regardless of source. Our analysis indicates only marginal changes in reported values after excluding redundant raw data (Table 3). We attribute this marginal difference to the robustness of reporting the median value rather than the mean. Based on this analysis, we chose not to remove redundant raw data values prior to merging the data.
Table 3. Summary of comparison of merged database values and merged values after excluding all redundant raw data points for a given species and parameter, regardless of source. Depending on the parameter, the mean change ranges between -9.7% and 22.1%. Across all parameters, the largest positive change was 275.3% (Longevity (y)), and the largest negative change was -95.7% (Birth/Hatching Weight (g))—these values are highlighted in grey. Maximum Longevity (y) is unchanged with and without including redundant values, because, by definition, it reflects only the largest raw data value from the data pool. For Male SVL (cm), deletion of redundant raw data points did not change any species’ reported values in a positive direction. For Fledging Mass (g) and Female SVL at Maturity (cm), deletion of redundant raw data points did not change any species’ reported values in a negative direction.
Parameter |
Number of Species with Redundant Raw Data Points |
Mean Change |
Max Up Change |
Max Down Change |
female_maturity_d |
414 |
-3.2% |
50.0% |
-46.2% |
litter_or_clutch_size_n |
2372 |
-0.6% |
158.3% |
-81.8% |
litters_or_clutches_per_y |
685 |
-3.7% |
70.6% |
-66.7% |
adult_body_mass_g |
1923 |
0.8% |
94.5% |
-79.7% |
maximum_longevity_y |
0 |
-- |
-- |
-- |
gestation_d |
412 |
-0.8% |
13.0% |
-38.6% |
weaning_d |
309 |
-0.5% |
49.9% |
-38.6% |
birth_or_hatching_weight_g |
549 |
-1.0% |
81.8% |
-95.7% |
weaning_weight_g |
267 |
-0.2% |
71.0% |
-86.2% |
egg_mass_g |
407 |
0.3% |
36.4% |
-44.2% |
incubation_d |
358 |
-0.4% |
57.1% |
-70.4% |
fledging_age_d |
46 |
2.0% |
44.1% |
-22.2% |
longevity_y |
1560 |
8.3% |
275.3% |
-68.0% |
male_maturity_d |
39 |
2.7% |
142.1% |
-75.1% |
inter_litter_or_interbirth_interval_y |
32 |
0.5% |
33.3% |
-36.8% |
female_body_mass_g |
787 |
0.3% |
82.8% |
-49.1% |
male_body_mass_g |
816 |
0.2% |
39.5% |
-19.2% |
no_sex_body_mass_g |
379 |
-0.1% |
54.1% |
-38.6% |
egg_width_mm |
7 |
-0.6% |
6.1% |
-10.3% |
egg_length_mm |
7 |
10.3% |
18.2% |
-3.6% |
fledging_mass_g |
2 |
0.6% |
0.6% |
-- |
adult_svl_cm |
72 |
1.6% |
17.7% |
-16.8% |
male_svl_cm |
19 |
-9.7% |
-- |
-17.8% |
female_svl_cm |
29 |
-1.8% |
4.3% |
-16.5% |
birth_or_hatching_svl_cm |
36 |
1.9% |
19.0% |
-7.7% |
female_svl_at_maturity_cm |
7 |
2.1% |
9.1% |
-- |
female_body_mass_at_maturity_g |
0 |
0.0% |
0.0% |
0.0% |
no_sex_svl_cm |
79 |
22.1% |
73.6% |
-5.6% |
no_sex_maturity_d |
18 |
2.1% |
33.3% |
-28.6% |
Prior to using our data files, researchers should validate the authenticity of the file using the column key totals contained in Table 4.
Table 4. Column totals that should be used as keys to validate the database authenticity prior to working with the data. For each database column, the column total with, and without, null values are provided.
Field Name |
Total with Null Values |
Total without Null Values (Null values are listed as -999) |
female_maturity_d |
-15430729.23 |
2400421.77 |
litter_or_clutch_size_n |
-8185714.63 |
50041.37 |
litters_or_clutches_per_y |
-16348958.80 |
8667.20 |
adult_body_mass_g |
620588050.37 |
625228405.37 |
maximum_longevity_y |
-15715616.84 |
90561.16 |
gestation_d |
-18654811.14 |
252262.86 |
weaning_d |
-19028768.90 |
230952.10 |
birth_or_hatching_weight_g |
-1898670.26 |
15862550.74 |
weaning_weight_g |
23794722.39 |
44032464.39 |
egg_mass_g |
-15770598.09 |
120494.91 |
incubation_d |
-17494444.10 |
169873.90 |
fledging_age_d |
-19390666.41 |
67855.59 |
longevity_y |
-15731812.95 |
74365.05 |
male_maturity_d |
-17649764.56 |
1608957.44 |
inter_litter_or_interbirth_interval_y |
-19882810.23 |
1285.77 |
female_body_mass_g |
866357.25 |
14965244.25 |
male_body_mass_g |
26501177.72 |
41165498.72 |
no_sex_body_mass_g |
654418411.31 |
666069748.31 |
egg_width_mm |
-20692593.46 |
13679.54 |
egg_length_mm |
-20658730.41 |
22567.59 |
fledging_mass_g |
-20994460.78 |
95428.22 |
adult_svl_cm |
-13990501.82 |
269224.18 |
male_svl_cm |
-21004735.69 |
14224.31 |
female_svl_cm |
-20199500.09 |
22257.91 |
birth_or_hatching_svl_cm |
-20049948.68 |
14966.32 |
female_svl_at_maturity_cm |
-21095104.10 |
3775.90 |
female_body_mass_at_maturity_g |
-20908552.00 |
388130.00 |
no_sex_svl_cm |
-15930557.06 |
105390.94 |
no_sex_maturity_d |
-20097854.87 |
741285.13 |
Class III. Data set status and accessibility
A. Status
Latest update: August 2015.
Latest Archive date: August 2015.
Data verification: See Technical Validation section in Methods.
B. Accessibility
Contact person: Nathan P. Myhrvold, Intellectual Ventures, Bellevue, WA 98005. [email protected]
Copyright restrictions: None.
Proprietary restrictions: Please cite this data paper when the data are used in publications..
Costs: None.
Class IV. Data structural descriptors
Amniote life history database
A. Data Set File
Identity: Amniote Database_Aug_2015.csv
Size: 4730 KB.
Format and storage mode: CSV.
Contents: This file contains the median values for each parameter for each species. This file is considered the final database output of the project.
B. Variable Information
class: The taxonomic class designation for the corresponding data entry
order: The taxonomic order designation for the corresponding data entry
family: The taxonomic family designation for the corresponding data entry
genus: The taxonomic genus designation for the corresponding data entry
species: The taxonomic species designation for the corresponding data entry
subspecies: The taxonomic subspecies designation for the corresponding data entry
common_name: The common name for the corresponding data entry
female_maturity_d: The amount of time it takes for a female individual to reach maturity in days
litter_or_clutch_size_n: The size of the litter/clutch
litters_or_clutches_per_y: The number of litters/clutches produced per year
adult_body_mass_g: The body mass of an adult individual in grams
maximum_longevity_y: The longest lifespan reported of the species in years
gestation_d: The time between conception and birth in days
weaning_d: The amount of time it takes to wean the offspring in days
birth_or_hatching_weight_g: The weight at birth/hatching in grams
weaning_weight_g: The weight at weaning in grams
egg_mass_g: The mass of the egg in grams
incubation_d: The time between when the egg is laid and when it hatches in days
fledging_age_d: The time it takes for the bird to be capable of flight (or for some species, leaving the nest) in days
longevity_y: The lifespan of an individual in years
male_maturity_d: The amount of time it takes for a male individual to reach maturity in days
Inter-litter_or_interbirth_interval_y: The time between the reproduction cycles in years
female_body_mass_g: The body mass of a female individual in grams
male_body_mass_g: The body mass of a male individual in grams
no_sex_body_mass_g: The body mass of an individual of unreported sex in grams
egg_width_mm: The width of the egg in millimeters
egg_length_mm: The length of the egg in millimeters
fledging_mass_g: The mass of a fledging in grams
adult_svl_cm: The snout-to-vent length of an adult individual in centimeters
male_svl_cm: The snout-to-vent length of a male individual in centimeters
female_svl_cm: The snout-to-vent length of a female individual in centimeters
hatching_svl_cm: The snout-to-vent length of a newly-hatched individual in centimeters
female_svl_at maturity_cm: The snout-to-vent length of a female individual at maturity in centimeters
female_body_mass_at_maturity_g: The body mass of a female individual at maturity in grams
no_sex_svl_cm: The snout-to-vent length of an individual of unreported sex in centimeters
no_sex_maturity_d: The amount of time it takes for an individual of unreported sex to reach maturity in days
AMNIOTE LIFE HISTORY DATABASE REFERENCES
A. Data Set File
Identity: Amniote_References_Aug_2015.csv
Size: 14,388 KB
Format: CSV
Contents: A duplicate database CSV file provides a key to the references underlying each data point included in the database. Most reported values are the median of multiple underlying values—this table describes which sources were used to obtain the median, as well as which source (or sources in the case of even numbers of values) was the median value.
B. Variable Information
class: The taxonomic class designation for the corresponding data entry
order: The taxonomic order designation for the corresponding data entry
family: The taxonomic family designation for the corresponding data entry
genus: The taxonomic genus designation for the corresponding data entry
species: The taxonomic species designation for the corresponding data entry
subspecies: The taxonomic subspecies designation for the corresponding data entry
common_name: The common name for the corresponding data entry
female_maturity_d: The amount of time it takes for a female individual to reach maturity in days
litter_or_clutch_size_n: The size of the litter/clutch
litters_or_clutches_per_y: The number of litters/clutches produced per year
adult_body_mass_g: The body mass of an adult individual in grams
maximum_longevity_y: The longest lifespan reported of the species in years
gestation_d: The time between conception and birth in days
weaning_d: The amount of time it takes to wean the offspring in days
birth_or_hatching_weight_g: The weight at birth/hatching in grams
weaning_weight_g: The weight at weaning in grams
egg_mass_g: The mass of the egg in grams
incubation_d: The time between when the egg is laid and when it hatches in days
fledging_age_d: The time it takes for the bird to be capable of flight (or for some species, leaving the nest) in days
longevity_y: The lifespan of an individual in years
male_maturity_d: The amount of time it takes for a male individual to reach maturity in days
Inter-litter_or_interbirth_interval_y: The time between the reproduction cycles in years
female_body_mass_g: The body mass of a female individual in grams
male_body_mass_g: The body mass of a male individual in grams
no_sex_body_mass_g: The body mass of an individual of unreported sex in grams
egg_width_mm: The width of the egg in millimeters
egg_length_mm: The length of the egg in millimeters
fledging_mass_g: The mass of a fledging in grams
adult_svl_cm: The snout-to-vent length of an adult individual in centimeters
male_svl_cm: The snout-to-vent length of a male individual in centimeters
female_svl_cm: The snout-to-vent length of a female individual in centimeters
hatching_svl_cm: The snout-to-vent length of a newly-hatched individual in centimeters
female_svl_at maturity_cm: The snout-to-vent length of a female individual at maturity in centimeters
female_body_mass_at_maturity_g: The body mass of a female individual at maturity in grams
no_sex_svl_cm: The snout-to-vent length of an individual of unreported sex in centimeters
no_sex_maturity_d: The amount of time it takes for an individual of unreported sex to reach maturity in days
AMNIOTE LIFE HISTORY SPARSE TABLE
A. Data Set File
Identity: Amniote_Sparse_Table_Aug_2015.csv
Size: 36,115 KB
Format: CSV
Contents: Contains one row (with a reference) for every raw data point we used to construct our database.
B. Variable Information
class: The taxonomic class designation for the corresponding data entry
order: The taxonomic order designation for the corresponding data entry
family: The taxonomic family designation for the corresponding data entry
genus: The taxonomic genus designation for the corresponding data entry
species: The taxonomic species designation for the corresponding data entry
subspecies: The taxonomic subspecies designation for the corresponding data entry
common_name: The common name for the corresponding data entry
female_maturity_d: The amount of time it takes for a female individual to reach maturity in days
litter_or_clutch_size_n: The size of the litter/clutch
litters_or_clutches_per_y: The number of litters/clutches produced per year
adult_body_mass_g: The body mass of an adult individual in grams
maximum_longevity_y: The longest lifespan reported of the species in years
gestation_d: The time between conception and birth in days
weaning_d: The amount of time it takes to wean the offspring in days
birth_or_hatching_weight_g: The weight at birth/hatching in grams
weaning_weight_g: The weight at weaning in grams
egg_mass_g: The mass of the egg in grams
incubation_d: The time between when the egg is laid and when it hatches in days
fledging_age_d: The time it takes for the bird to be capable of flight (or for some species, leaving the nest) in days
longevity_y: The lifespan of an individual in years
male_maturity_d: The amount of time it takes for a male individual to reach maturity in days
Inter-litter_or_interbirth_interval_y: The time between the reproduction cycles in years
female_body_mass_g: The body mass of a female individual in grams
male_body_mass_g: The body mass of a male individual in grams
no_sex_body_mass_g: The body mass of an individual of unreported sex in grams
egg_width_mm: The width of the egg in millimeters
egg_length_mm: The length of the egg in millimeters
fledging_mass_g: The mass of a fledging in grams
adult_svl_cm: The snout-to-vent length of an adult individual in centimeters
male_svl_cm: The snout-to-vent length of a male individual in centimeters
female_svl_cm: The snout-to-vent length of a female individual in centimeters
hatching_svl_cm: The snout-to-vent length of a newly-hatched individual in centimeters
female_svl_at maturity_cm: The snout-to-vent length of a female individual at maturity in centimeters
female_body_mass_at_maturity_g: The body mass of a female individual at maturity in grams
no_sex_svl_cm: The snout-to-vent length of an individual of unreported sex in centimeters
no_sex_maturity_d: The amount of time it takes for an individual of unreported sex to reach maturity in days
AMNIOTE LIFE HISTORY DATA RANGES/ COUNTS
A. Data Set File
Identity: Amniote_Range_Count_Aug_2015.csv
Size: 8,608 KB
Format: CSV
Contents: Lists the minimum value and the maximum value for each parameter, as well as the number of data points obtained for each parameter.
B. Variable Information
classx: The taxonomic class designation for the corresponding data entry
orderx: The taxonomic order designation for the corresponding data entry
familyx: The taxonomic family designation for the corresponding data entry
genus: The taxonomic genus designation for the corresponding data entry
species: The taxonomic species designation for the corresponding data entry
subspecies: The taxonomic subspecies designation for the corresponding data entry
common_name: The common name for the corresponding data entry
min_female_maturity: The minimum value for female maturity for the corresponding data entry
max_female_maturity: The maximum value for female maturity for the corresponding data entry
count_female_maturity: The number of data points for female maturity for the corresponding data entry
min_male_maturity: The minimum value for male maturity for the corresponding data entry
max_male_maturity: The maximum value for male maturity for the corresponding data entry
count_male_maturity: The number of data points for male maturity for the corresponding data entry
min_gestation: The minimum value for gestation for the corresponding data entry
max_gestation: The maximum value for male maturity for the corresponding data entry
count_gestation: The number of data points for male maturity for the corresponding data entry
min_weaning: The minimum value for weaning for the corresponding data entry
max_weaning: The maximum value for weaning for the corresponding data entry
count_weaning: The number of data points for weaning for the corresponding data entry
min_litter_clutch_size: The minimum value for litter/clutch size for the corresponding data entry
max_litter_clutch_size: The maximum value for litter/clutch size for the corresponding data entry
count_litter_clutch_size: The number of data points for litter/clutch size for the corresponding data entry
min_litters_clutches: The minimum value for litters/clutches for the corresponding data entry
max_litters_clutches: The maximum value for litters/clutches for the corresponding data entry
count_litters_clutches: The number of data points for litters/clutches for the corresponding data entry
min_inter_litter_interbirth_interval: The minimum value for litter/interbirth interval for the corresponding data entry
max_inter_litter_interbirth_interval: The maximum value for litter/interbirth interval for the corresponding data entry
count_inter_litter_interbirth_interval: The number of data points for litter/interbirth interval for the corresponding data entry
min_birth_hatching_weight: The minimum value for birth/hatching weight for the corresponding data entry
max_birth_hatching_weight: The maximum value for birth/hatching weight for the corresponding data entry
count_birth_hatching_weight: The number of data points for birth/hatching weight for the corresponding data entry
min_weaning_weight: The minimum value for weaning weight for the corresponding data entry
max_weaning_weight: The maximum value for weaning weight for the corresponding data entry
count_weaning_weight: The number of data points for weaning weight for the corresponding data entry
min_adult_body_mass: The minimum value for adult body mass for the corresponding data entry
max_adult_body_mass: The maximum value for adult body mass for the corresponding data entry
count_adult_body_mass: The number of data points for adult body mass for the corresponding data entry
min_female_body_mass: The minimum value for female body mass for the corresponding data entry
max_female_body_mass: The maximum value for female body mass for the corresponding data entry
count_female_body_mass: The number of data points for female body mass for the corresponding data entry
min_maximum_longevity: The minimum value for maximum longevity for the corresponding data entry
max_maximum_longevity: The maximum value for maximum longevity for the corresponding data entry
count_maximum_longevity: The number of data points for maximum longevity for the corresponding data entry
min_male_body_mass: The minimum value for male body mass for the corresponding data entry
max_male_body_mass: The maximum value for male body mass for the corresponding data entry
count_male_body_mass: The number of data points for male body mass for the corresponding data entry
min_no_sex_body_mass: The minimum value for unreported sex body mass for the corresponding data entry
max_no_sex_body_mass: The maximum value for unreported sex body mass for the corresponding data entry
count_no_sex_body_mass: The number of data points for unreported sex body mass for the corresponding data entry
min_egg_mass: The minimum value for egg mass for the corresponding data entry
max_egg_mass: The maximum value for egg mass for the corresponding data entry
count_egg_mass: The number of data points for egg mass for the corresponding data entry
min_egg_width: The minimum value for egg width for the corresponding data entry
max_egg_width: The maximum value for egg width for the corresponding data entry
count_egg_width: The number of data points for egg width for the corresponding data entry
min_egg_length: The minimum value for egg length for the corresponding data entry
max_egg_length: The maximum value for egg length for the corresponding data entry
count_egg_length: The number of data points for egg length for the corresponding data entry
min_incubation: The minimum value for incubation for the corresponding data entry
max_incubation: The maximum value for incubation for the corresponding data entry
count_incubation: The number of data points for incubation for the corresponding data entry
min_fledging_mass: The minimum value for fledging mass for the corresponding data entry
max_fledging_mass: The maximum value for fledging mass for the corresponding data entry
count_fledging_mass: The number of data points for fledging mass for the corresponding data entry
min_fledging_age: The minimum value for fledging age for the corresponding data entry
max_fledging_age: The maximum value for fledging age for the corresponding data entry
count_fledging_age: The number of data points for fledging age for the corresponding data entry
min_adult_svl: The minimum value for adult SVL for the corresponding data entry
max_adult_svl: The maximum value for adult SVL for the corresponding data entry
count_adult_svl: The number of data points for adult SVL for the corresponding data entry
min_male_svl: The minimum value for male SVL for the corresponding data entry
max_male_svl: The maximum value for male SVL for the corresponding data entry
count_male_svl: The number of data points for male SVL for the corresponding data entry
min_female_svl: The minimum value for female SVL for the corresponding data entry
max_female_svl: The maximum value for female SVL for the corresponding data entry
count_female_svl: The number of data points for female SVL for the corresponding data entry
min_hatching_svl: The minimum value for hatching SVL for the corresponding data entry
max_hatching_svl: The maximum value for hatching SVL for the corresponding data entry
count_hatching_svl: The number of data points for hatching SVL for the corresponding data entry
min_female_svl_at_maturity: The minimum value for female SVL at maturity for the corresponding data entry
max_female_svl_at_maturity: The maximum value for female SVL at maturity for the corresponding data entry
count_female_svl_at_maturity: The number of data points for female SVL at maturity for the corresponding data entry
min_female_body_mass_at_maturity: The minimum value for female body mass at maturity for the corresponding data entry
max_female_body_mass_at_maturity: The maximum value for female body mass at maturity for the corresponding data entry
count_female_body_mass_at_maturity: The number of data points for female body mass at maturity for the corresponding data entry
min_no_sex_svl: The minimum value for unreported sex SVL for the corresponding data entry
max_no_sex_svl: The maximum value for unreported sex SVL for the corresponding data entry
count_no_sex_svl: The number of data points for unreported sex SVL for the corresponding data entry
min_no_sex_maturity: The minimum value for unreported sex maturity for the corresponding data entry
max_no_sex_maturity: The maximum value for unreported sex maturity for the corresponding data entry
count_no_sex_maturity: The number of data points for unreported sex maturity for the corresponding data entry
DATABASE LITERATURE CITED
A. Data Set File
Identity: Supplemental Table 1 – Database Literature Cited.pdf
Size: 732 KB
Format: PDF
Contents: Literature cited for data contained within the database.
B. Variable Information
NA
REFERENCE COUNTS
A. Data Set File
Identity: Supplemental Table 2 – Reference Counts.csv
Size: 38 KB
Format: CSV
Contents: Counts of the number of data points obtained from each data source. Full citations for the data sources are available in Supplemental Table 1.
B. Variable Information
Reference Name: The authors and publishing year of the reference
Number of records from reference: The number of records in the data set from each reference
AVES NAME TRANSFORMATIONS
A. Data Set File
Identity: Supplemental Table 3 – Aves Name Transformations.csv
Size: 1,202 KB
Format: CSV
Contents: List of all name transformations identified for Aves. These name transformations include synonyms as well as spelling or other erroneous entries identified in the raw data. Each transformation maps a single avian species, as found in the source data, to a currently accepted species according to the IOC World Bird List v4.1 (Gill and Donsker 2014).
B. Variable Information
Original name: The original genus, species, or subspecies combination
Transformed name: The transformed genus, species, or subspecies combination
MAMMALIA NAME TRANSFORMATIONS
A. Data Set File
Identity: Supplemental Table 4 – Mammalia Name Transformations.csv
Size: 1,651 KB
Format: CSV
Contents: List of all name transformations identified for Mammalia. These name transformations include synonyms as well as spelling or other erroneous entries identified in the raw data. Each transformation maps a single mammal species, as found in the source data, to a currently accepted species according to Mammal Species of the World (Wilson and Reeder 2005).
B. Variable Information
Original name: The original genus, species, or subspecies combination
Transformed name: The transformed genus, species, or subspecies combination
REPTILIA NAME TRANSFORMATIONS
A. Data Set File
Identity: Supplemental Table 5 – Reptilia Name Transformations.csv
Size: 1,333 KB
Format: CSV
Contents: List of all name transformations identified for Reptilia. These name transformations include synonyms as well as spelling or other erroneous entries identified in the raw data. Each transformation maps a single reptile species, as found in the source data, to a currently accepted species according to The Reptile Database (Uetz and Hosek 2014).
B. Variable Information
Original name: The original genus, species, or subspecies combination
Transformed name: The transformed genus, species, or subspecies combination
AVES SYNOYNMS
A. Data Set File
Identity: Supplemental Table 6 - Aves Synonyms.csv
Size: 8878 KB
Format: CSV
Contents: A list of all of the Aves name transformations that we employed when creating the database. This is a comprehensive list detailing every possible synonym we identified using our data-sharing rules described in the methods section. For instance, if Supplemental Tables 2–4 list hypothetical species A and B as synonyms, and hypothetical species B and C as synonyms, this table would list A/B, A/C, and B/C as synonym pairs.
B. Variable Information
Class: Class name as reported in source data
Family: Family name as reported in source data
Order: Order name as reported in source data
Genus: Genus name as reported in source data
Species: Species name as reported in source data
Subspecies: Subspecies name as reported in source data
Common name: Common name as reported in source data
Synonymous Class: Class name that appears in the final dataset
Synonymous Family: Family name that appears in the final dataset
Synonymous Order: Order name that appears in the final dataset
Synonymous Genus: Genus name that appears in the final dataset
Synonymous Species: Species name that appears in the final dataset
Synonymous Subspecies: Subspecies name that appears in the final dataset
Synonymous Common name: Common name that appears in the final dataset
Ref name: Reference that the data came from
MAMMALIA SYNONYMS
A. Data Set File
Identity: Supplemental Table 7 – Mammalia Synonyms.csv
Size: 6188 KB
Format: CSV
Contents: A list of all of the Mammalia name transformations that we employed when creating the database. This is a comprehensive list detailing every possible synonym we identified using our data-sharing rules described in the methods section. For instance, if Supplemental Tables 2–4 list hypothetical species A and B as synonyms, and hypothetical species B and C as synonyms, this table would list A/B, A/C, and B/C as synonym pairs.
B. Variable Information
Class: Class name as reported in source data
Family: Family name as reported in source data
Order: Order name as reported in source data
Genus: Genus name as reported in source data
Species: Species name as reported in source data
Subspecies: Subspecies name as reported in source data
Common name: Common name as reported in source data
Synonymous Class: Class name that appears in the final dataset
Synonymous Family: Family name that appears in the final dataset
Synonymous Order: Order name that appears in the final dataset
Synonymous Genus: Genus name that appears in the final dataset
Synonymous Species: Species name that appears in the final dataset
Synonymous Subspecies: Subspecies name that appears in the final dataset
Synonymous Common name: Common name that appears in the final dataset
Ref name: Reference that the data came from
REPTILIA SYNONYMS
A. Data Set File
Identity: Supplemental Table 8 – Reptilia Synonyms.csv
Size: 5567 KB
Format: CSV
Contents: A list of all of the Reptilia name transformations that we employed when creating the database. This is a comprehensive list detailing every possible synonym we identified using our data-sharing rules described in the methods section. For instance, if Supplemental Tables 2–4 list hypothetical species A and B as synonyms, and hypothetical species B and C as synonyms, this table would list A/B, A/C, and B/C as synonym pairs.
B. Variable Information
Class: Class name as reported in source data
Family: Family name as reported in source data
Order: Order name as reported in source data
Genus: Genus name as reported in source data
Species: Species name as reported in source data
Subspecies: Subspecies name as reported in source data
Common name: Common name as reported in source data
Synonymous Class: Class name that appears in the final dataset
Synonymous Family: Family name that appears in the final dataset
Synonymous Order: Order name that appears in the final dataset
Synonymous Genus: Genus name that appears in the final dataset
Synonymous Species: Species name that appears in the final dataset
Synonymous Subspecies: Subspecies name that appears in the final dataset
Synonymous Common name: Common name that appears in the final dataset
Ref name: Reference that the data came from
A. Data Set File
Identity: Supplemental Table 9 – Data Set Field Information.csv
Size: 11 KB
Format: CSV
Contents: Location and description of fields included in Amniote Database, August 2015.
B. Variable Information
Field Number: Lists the column position of the field in the data set
Field Name: Lists the name of the field
Units: Lists the units the field is in
Taxonomic Group: Lists which taxonomic groups each field encompasses. A=Aves, R=Reptiles, M=Mammals
Description: Provides a short description for each field
A1. Data Forms and Location:
All Mathematica 10, EXCEL 2010 datasheets, and CSV files reside at Intellectual Ventures located at 3150 139th Avenue Southeast, Bellevue, WA 98005
A2. Competing Interests: The authors declare no competing financial interests.
NPM, EB, DLF, and SKME conceived of, designed, and developed the database. NPM, EB, BC, DLF, SKME collected data and provided technical validation. NPM, EB, DLF, DS, and SKME wrote the manuscript.
Acknowledgments
The authors would like to graciously acknowledge the many scientists, researchers, and hobbyists whose data collection and contributions made this work possible.
Literature cited
Cardillo, M., G. M. Mace, K. E. Jones, J. Bielby, O. R. P. Bininda-Emonds, W. Sechrest, C. D. L. Orme, and A. Purvis. 2005. Multiple causes of high extinction risk in large mammal species. Science (New York, N.Y.) 309:1239–41.
Charnov, E. L., and S. K. M. Ernest. 2006. The offspring-size/clutch-size trade-off in mammals. The American naturalist 167:578–82.
Classification of Mammals: Notions of taxonomy. (n.d.). http://www.planet-mammiferes.org/drupal/en/node/37?taxon=1.
Gill, F., and D. Donsker. 2014. IOC World Bird List (v4.1). (F. Gill and D. Donsker, Eds.).
Green, R. E., E. L. Braun, J. Armstrong, D. Earl, N. Nguyen, G. Hickey, M. W. Vandewege, J. A. St. John, S. Capella-Gutierrez, T. A. Castoe, C. Kern, M. K. Fujita, J. C. Opazo, J. Jurka, K. K. Kojima, J. Caballero, R. M. Hubley, A. F. Smit, R. N. Platt, C. A. Lavoie, M. P. Ramakodi, J. W. Finger, A. Suh, S. R. Isberg, L. Miles, A. Y. Chong, W. Jaratlerdsiri, J. Gongora, C. Moran, A. Iriarte, J. McCormack, S. C. Burgess, S. V. Edwards, E. Lyons, C. Williams, M. Breen, J. T. Howard, C. R. Gresham, D. G. Peterson, J. Schmitz, D. D. Pollock, D. Haussler, E. W. Triplett, G. Zhang, N. Irie, E. D. Jarvis, C. A. Brochu, C. J. Schmidt, F. M. McCarthy, B. C. Faircloth, F. G. Hoffmann, T. C. Glenn, T. Gabaldon, B. Paten, and D. A. Ray. 2014. Three crocodilian genomes reveal ancestral patterns of evolution among archosaurs. Science 346:1254449–1254449.
Jones, K. E., J. Bielby, M. Cardillo, S. a. Fritz, J. O’Dell, C. D. L. Orme, K. Safi, W. Sechrest, E. H. Boakes, C. Carbone, C. Connolly, M. J. Cutts, J. K. Foster, R. Grenyer, M. Habib, C. A. Plaster, S. A. Price, E. A. Rigby, J. Rist, A. Teacher, O. R. P. Bininda-Emonds, J. L. Gittleman, G. M. Mace, and A. Purvis. 2009. PanTHERIA: a species-level database of life history, ecology, and geography of extant and recently extinct mammals. Ecology 90:2648–2648.
De Magalhães, J. P., and J. Costa. 2009. A database of vertebrate longevity records and their relation to other life-history traits. Journal of evolutionary biology 22:1770–4.
Meiri, S., J. H. Brown, and R. M. Sibly. 2011. The ecology of lizard reproductive output. Global Ecology and Biogeography 21:592–602.
Monroe, B., and C. G. Sibley. 1997. A World Checklist of Birds. Yale University Press.
O’Leary, M. A., J. I. Bloch, J. J. Flynn, T. J. Gaudin, A. Giallombardo, N. P. Giannini, S. L. Goldberg, B. P. Kraatz, Z.-X. Luo, J. Meng, X. Ni, M. J. Novacek, F. A. Perini, Z. S. Randall, G. W. Rougier, E. J. Sargis, M. T. Silcox, N. B. Simmons, M. Spaulding, P. M. Velazco, M. Weksler, J. R. Wible, and A. L. Cirranello. 2013. The placental mammal ancestor and the post-K-Pg radiation of placentals. Science (New York, N.Y.) 339:662–7.
Pagel, M. 1999. Inferring the historical patterns of biological evolution. Nature 401:877–84.
Promislow, D. E. L., and P. H. Harvey. 1990. Living fast and dying young: A comparative analysis of life-history variation among mammals. Journal of Zoology, London 220:417–437.
Ricklefs, R. E. 1968. Patterns of growth in birds. The IBIS 110:419–451.
Sullivan, B. L., C. L. Wood, M. J. Iliff, R. E. Bonney, D. Fink, and S. Kelling. 2009. eBird: a citizen-based bird observation network in the biological sciences. Biological Conservation 142:2282–2292.
The NCBI ftp site: Taxonomy. (n.d.). . ftp://ftp.ncbi.nlm.nih.gov/pub/taxonomy/.
Thorson, J. T., J. M. Cope, and W. S. Patrick. 2013. Assessing the quality of life history information in publicly available databases. Ecological Applications.
Uetz, P., and J. Hosek. 2014. The Reptile Database. http://www.reptile-database.org/.
Wilson, D., and D. Reeder. 2005. Mammal Species of the World. (D. E. Wilson and D. M. Reeder, Eds.). Johns Hopkins University Press.