Ecological Archives E096-262-A2
Rachael Derbyshire, Dan Strickland, and D. Ryan Norris. 2015. Experimental evidence and 43 years of monitoring data show that food limits reproduction in a food-caching passerine. Ecology 96:30053015. http://dx.doi.org/10.1890/15-0191.1
Appendix B. Estimating nestling body condition.
To estimate nestling body condition, we implemented the following two steps: (1) calculated first principal component scores (PC1) from three morphological measurements of known-age nestlings and then examined whether these scores were an accurate reflection of age; (2) modeled the relationship between mass and PC1 scores of known-age nestlings and then used the residuals from this model to generate an estimate of body condition (mass given body size) for unknown-age nestlings.
We used data from known-age nestlings collected between 1979–2012 (n = 26 nests, n = 77 nestlings). Most of these known-age nestlings (n = 51) were weighed every day from hatch date until a mean of 16 days of age (range = 12–21 d). However, some known-age nestlings were only weighed once (n = 26). For step 1, we used measurements of bill length, tarsus length and 7th primary length from all known-age nestlings to conduct a principal component analysis on a correlation matrix (Dunteman 1989, Rising and Somers 1989) that generated three principal component axes, and where the first principal component score (PC1) explained 94% of the variance and PC1 had strong positive loadings for all three morphological measurements (bill length = 0.59, tarsus length = 0.58, 7th primary length = 0.57; Table B1). The PC1 scores explained 94% of the variation in age at banding for known-age nestlings (age range: 4–12 d, R² = 0.94, b = 2.37, P < 0.001, n = 417) and thus, we considered PC1 scores a good estimate of nestling age.
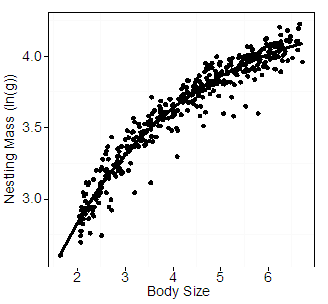
To select the best model for the relationship between mass and size (step 2), PC1 scores of all nestlings from the long-term (including the known-age nestlings) and experimental datasets were then calculated so that any models generated with the known-age data would be scaled properly to the PC1 scores of all nestlings in both datasets. Then, the revised PC1 scores of only the known-age nestlings were plotted against mass (Fig. B1). To select the best-fitting model for this relationship, we used Akaike Information Criteria model selection scores for small sample sizes (AICc; Burnham and Anderson 2002) using AICcmodavg (R package v. 3.0-1; Mazerolle 2013) to test three competing models: a power function, an exponential model, and an asymptotic exponential model. Each of these models can be used to describe biological relationships, including allometric scaling relationships and growth (Logan 2010). Based on AICc, the best-fitting model was an asymptotic exponential model (nestling mass (ln(g)) = a+b*exp(c*PC1 score); a = 4.35, b = -3.23, c = -0.38; Table B2). We considered the residuals from this asymptotic exponential function as the estimate of condition (mass given body size) for unknown age nestlings (Schulte-Hostedde et al. 2005, Harms et al. 2010).
Literature cited
Burnham, K. P., and D. R. Anderson. 2002. Model selection and multimodel inference: a practical information-theoretic approach, Second edition. Springer-Verlag, New York, New York, USA.
Dunteman, G. H. 1989. Principal Components Analysis. SAGE Publications, Newbury Park, California, USA.
Harms, J. N., G. D. Fairhurst, G. R. Bortolotti, and J. E. G. Smits. 2010. Variation in immune function, body condition, and feather corticosterone in nestling tree swallows (Tachycineta bicolor) on reclaimed wetlands in the Athabasca oil sands, Alberta, Canada. Environmental Pollution 158:841–848.
Logan, M. 2010. Biostatistical Design and Analysis Using R: A Practical Guide. Wiley-Blackwell, West Sussex, UK.
Mazerolle, M. J. 2013. AICcmodavg: Model selection and multimodel inference based on (Q)AIC(c) v. 1.3-5. http://CRAN.R-project.org/package=AICcmodavg
Rising, J. D., and K. M. Somers. 1989. The measurement of overall body size in birds. Auk 106: 666–674.
Schulte-Hostedde, A. I., B. Zinner, J. S. Millar, and G. J. Hickling. 2005. Restitution of mass–size residuals: validating body condition indices. Ecology 86:155–163.
Table B1. Principal component loadings for the three morphological measurements (bill length (mm), tarsus length (mm), and seventh primary length (mm)) used in a Principal Components Analysis (PCA) to generate a single measure for body size. The first principal component has strong positive loadings, and was therefore used as a measure of body size in our estimates of nestling body condition.
|
Component 1 |
Component 2 |
Component 3 |
Bill |
0.59 |
0.25 |
-0.77 |
Tarsus |
0.58 |
0.54 |
0.61 |
Seventh Primary |
0.57 |
-0.81 |
0.17 |
Table B2. Log-likelihood (LgL), Akaike Information Criteria model selection scores for small sample sizes (AICc), ΔAICc, and Akaike weights (AICcw) for model competition between three different models used to explain nestling growth rate. A total of 417 measurements of mass (g) and first principal component scores (PC1) of tarsus length (mm), seventh primary length (mm) and bill length (mm) from 77 nestlings in 26 nests were plotted, and the following models fit to this relationship. Models are listed in order from best to worst fit based on ΔAICc.
Model |
LgL |
AICc |
ΔAICc |
AICcw |
Asymptotic exponential |
405.98 |
-803.87 |
0.00 |
1.00 |
Power |
371.20 |
-763.34 |
67.53 |
0.00 |
Exponential |
262.46 |
-518.87 |
285.00 |
0.00 |
Fig. B1. Log-transformed mass (g) of known-age nestling Gray Jays plotted against body size, estimated from the first principal component score (PC1) of bill length (mm), tarsus length (mm), and seventh primary length (mm). The asymptotic exponential line represents the best fitting model from Table B2.