Ecological Archives E096-261-A1
Phillip M. Bumpers, John C. Maerz, Amy D. Rosemond, and Jonathan P. Benstead. 2015. Salamander growth rates increase along an experimental stream phosphorus gradient. Ecology 96:29943004. http://dx.doi.org/10.1890/14-1772.1
Appendix A. Added nutrient concentrations and supplementary results, including AIC model results, the number of larvae recovered during the enclosure study for each stream, and the number of larvae captured during CMR. Additionally, average body size of E. wilderae in each treatment stream and its relationship with added and measured phosphorus concentrations is included.
Table A1. Mean (± SE) dissolved inorganic nitrogen (DIN) and soluble reactive phosphorus (SRP) concentrations (μg/L) and the corresponding molar N:P ratio added to each treatment stream to achieve target concentrations. Values for YR1 (July 2011–June 2012) and YR2 (July 2012–July 2013) are the estimated concentration that was delivered to each stream. This value incorporates known added concentrations of N and P from a detailed refill record divided by the discharge plus ambient concentration of nutrients determined from water samples taken upstream of the treatment reaches in each stream. Streams are identified by their target N:P ratio.
|
Stream |
|||||||||
|
2:1 |
8:1 |
16:1 |
32:1 |
128:1 |
|||||
DIN |
YR1 |
110 ±10.2 |
232 ±18.5 |
440 ±41.2 |
373 ±21.2 |
428 ±30.7 |
||||
YR2 |
82 ±5.1 |
151 ±6.7 |
377 ±21.0 |
381 ±10.0 |
517 ±21.7 |
|||||
SRP |
YR1 |
93 ±5.2 |
52 ±4.6 |
56 ±6.2 |
24 ±1.8 |
10 ±0.9 |
||||
YR2 |
77 ±4.2 |
37 ±1.5 |
54 ±3.0 |
28 ±0.9 |
11 ±0.4 |
|||||
N:P |
YR1 |
3 ±0.2 |
11 ±1.1 |
18 ±0.6 |
38 ±2.4 |
104 ±3.7 |
||||
YR2 |
3 ±0.2 |
10 ±0.9 |
15 ±0.2 |
31 ±0.8 |
109 ±2.4 |
|||||
Table A2. Linear regression parameter estimates and support for models based on AICC for Desmognathus quadramaculatus growth rates fromenclosures in the five treatment streams. Each model contains season as a predictor and the annual average (unique for each experimental time period) concentration of either nitrogen (N, as dissolved inorganic nitrogen), soluble reactive phosphorus (P), or the N:P ratio (molar) that was either experimentally added to the streams (i.e., ambient plus concentrated nutrient solution added to treatment reaches) or the measured in-stream concentration (which reflects added nutrients and in-stream biological processing). The N:P ratio was ln-transformed to meet assumptions of linearity. The number of parameters (K), AICC score, the change in AICC (ΔAICC), weight of support (Wi, Cum Wi), log likelihood (LL), intercept and slope estimates (SE), and P values are reported for all models included in model selection. Models are ranked by lowest AICC value. Bolded P values highlight statistically significant values (α = 0.05).
Model |
K |
AICC |
ΔAICC |
Wi |
Cum Wi |
LL |
Estimate |
SE |
P |
Added P, Season |
4 |
-220.8 |
0 |
0.36 |
0.36 |
115.83 |
|||
Intercept |
-0.0015480 |
0.0002998 |
<0.001 |
||||||
Added P |
0.0000146 |
0.0000048 |
0.0079 |
||||||
Season |
|
|
|
|
|
|
0.0013790 |
0.0002993 |
<0.001 |
Measured N:P, Season |
4 |
-220.77 |
0.03 |
0.35 |
0.71 |
115.81 |
|||
Intercept |
0.0001255 |
0.0004480 |
0.783 |
||||||
ln (Measured N:P) |
-0.0003450 |
0.0001143 |
0.0081 |
||||||
Season |
|
|
|
|
|
|
0.0013754 |
0.0002933 |
<0.001 |
Added N:P, Season |
4 |
-219.18 |
1.62 |
0.16 |
0.87 |
115.02 |
|||
Intercept |
-0.0000726 |
0.0004338 |
0.869 |
||||||
ln (Added N:P) |
-0.0002822 |
0.0001057 |
0.0167 |
||||||
Season |
|
|
|
|
|
|
0.0013700 |
0.0003058 |
<0.001 |
Measured P, Season |
4 |
-218.2 |
2.6 |
0.10 |
0.96 |
114.53 |
|||
Intercept |
-0.0015110 |
0.0003300 |
<0.001 |
||||||
Measured P |
0.0000176 |
0.0000072 |
0.0266 |
||||||
Season |
|
|
|
|
|
|
0.0013510 |
0.0003137 |
<0.001 |
Season |
3 |
-215.44 |
5.36 |
0.02 |
0.99 |
111.52 |
|||
Intercept |
-0.0010135 |
0.0002949 |
0.00315 |
||||||
Season |
|
|
|
|
|
|
0.0013540 |
0.0003566 |
0.00144 |
Added N, Season |
4 |
-212.88 |
7.92 |
0.01 |
1 |
111.87 |
|||
Intercept |
-0.0012830 |
0.0004597 |
0.0131 |
||||||
Added N |
0.0000009 |
0.0000012 |
0.452 |
||||||
Season |
|
|
|
|
|
|
0.0013670 |
0.0003613 |
0.00163 |
Measured N, Season |
4 |
-212.19 |
8.61 |
0.00 |
1 |
111.52 |
|||
Intercept |
-0.0010430 |
0.0005006 |
0.0536 |
||||||
Measured N |
0.0000001 |
0.0000018 |
0.942 |
||||||
Season |
|
|
|
|
|
|
0.0013550 |
0.0003675 |
0.002 |
Table A3. Linear regression parameter estimates and support for models based on AICC for free-roaming Desmognathus quadramaculatus growth rates in the five treatment streams. Parameter definitions are defined in Table A2.
Model |
K |
AICC |
ΔAICC |
Wi |
Cum Wi |
LL |
Estimate |
SE |
P |
Measured P |
3 |
-37.06 |
0 |
0.84 |
0.84 |
33.53 |
|||
Intercept |
-0.0015300 |
0.0003700 |
0.026 |
||||||
Measured P |
|
|
|
|
|
|
0.0000350 |
0.0000099 |
0.039 |
Added N |
3 |
-31.47 |
5.59 |
0.05 |
0.89 |
30.73 |
|||
Intercept |
0.0005488 |
0.0007000 |
0.49 |
||||||
Added N |
|
|
|
|
|
|
-0.0000030 |
0.0000021 |
0.25 |
Added N:P |
3 |
-30.98 |
6.08 |
0.04 |
0.93 |
30.49 |
|||
Intercept |
0.0005580 |
0.0008000 |
0.53 |
||||||
ln (Added N:P) |
|
|
|
|
|
|
-0.0031980 |
0.0002555 |
0.298 |
Measured N:P |
3 |
-30.32 |
6.74 |
0.03 |
0.96 |
30.16 |
|||
Intercept |
0.0008387 |
0.0012409 |
0.548 |
||||||
ln (Measured N:P) |
|
|
|
|
|
|
-0.0034500 |
0.0003438 |
0.39 |
Added P |
3 |
-29.79 |
7.27 |
0.02 |
0.98 |
29.9 |
|||
Intercept |
-0.0008149 |
0.0006813 |
0.318 |
||||||
Added P |
|
|
|
|
|
|
0.0000104 |
0.0000134 |
0.492 |
Measured N |
3 |
-29.79 |
7.27 |
0.02 |
1 |
29.9 |
|||
Intercept |
0.0003277 |
0.0009506 |
0.753 |
||||||
Measured N |
|
|
|
|
|
|
-0.0000027 |
0.0000034 |
0.492 |
Table A4. Linear regression parameter estimates and support for models based on AICC for average body sizes (as snout vent length; SVL) of free-roaming Eurycea wilderae just before metamorphosis in May of each treatment yearin the five treatment streams. Each model contains the treatment year (Year) as a predictor. Parameter definitions are according to those in Table A2.
Model |
K |
AICC |
ΔAICC |
Wi |
Cum Wi |
LL |
Estimate |
SE |
P |
Added N:P, Year |
4 |
30.09 |
0 |
0.46 |
0.46 |
-7.04 |
|||
Intercept |
19.92450 |
0.73500 |
<0.001 |
||||||
ln (Added N:P) |
-0.97150 |
0.14920 |
<0.001 |
||||||
Year |
|
|
|
|
|
|
1.61860 |
0.37010 |
0.00326 |
Measured N:P, Year |
4 |
30.87 |
0.78 |
0.31 |
0.78 |
-7.43 |
|||
Intercept |
21.29860 |
0.91790 |
<0.001 |
||||||
ln (Measured N:P) |
-1.20940 |
0.19440 |
<0.001 |
||||||
Year |
|
|
|
|
|
|
1.61310 |
0.38490 |
0.00408 |
Added P, Year |
4 |
31.58 |
1.49 |
0.22 |
0.99 |
-7.79 |
|||
Intercept |
14.97772 |
0.74332 |
<0.001 |
||||||
Added P |
0.04620 |
0.00775 |
<0.001 |
||||||
Year |
|
|
|
|
|
|
1.91836 |
0.40045 |
0.001988 |
Added N, Year |
4 |
39.79 |
9.7 |
0 |
1 |
-11.89 |
|||
Intercept |
19.34500 |
1.16400 |
<0.001 |
||||||
Added N |
-0.00723 |
0.00210 |
0.011 |
||||||
Year |
|
|
|
|
|
|
1.62835 |
0.60110 |
0.0303 |
Measured P, Year |
4 |
42.19 |
12.1 |
0 |
1 |
-13.09 |
|||
Intercept |
15.19059 |
1.40350 |
<0.001 |
||||||
Measured P |
0.04787 |
0.01721 |
0.0272 |
||||||
Year |
|
|
|
|
|
|
2.30562 |
0.71226 |
0.0143 |
Year |
4 |
43.63 |
13.54 |
0 |
1 |
-16.82 |
|||
Intercept |
17.10170 |
1.45390 |
<0.001 |
||||||
Year |
|
|
|
|
|
|
1.69380 |
0.91950 |
0.103 |
Measured N, Year |
4 |
49.45 |
19.36 |
0 |
1 |
-16.72 |
|||
Intercept |
17.29760 |
1.59750 |
<0.001 |
||||||
Measured N |
-0.00061 |
0.00168 |
0.729 |
||||||
Year |
|
|
|
|
|
|
1.73640 |
0.98110 |
0.12 |
Table A5. Time (days) that Desmognathus quadramaculatus larvae were left in enclosures for each stream, and the number of individuals recovered from each stream during each of the three seasons of enclosure experiments. Growth rates were also determined on individuals from reference conditions (Ref) in one stream during Spring 2012 and Fall 2012 and two streams during Spring 2013. Also reported is the number of recaptured individuals (CMR Recaps) from which growth rates were quantified for free-roaming Dq from each stream over the two years of enrichment. “Ref” indicates the control cages that were placed upstream of the treatment reaches.
Stream |
Days in Enclosure (# of larvae recovered) |
|
||
Ratio |
Spring 2012 |
Fall 2012 |
Spring 2013 |
CMR Recaps |
2:1 |
98 (10), 103 (4) |
101 (3), 116 (8) |
80 (13) |
19 |
8:1 |
93 (7), 92 (4), 104 (3) |
114 (5), 101 (1) |
80 (11) |
21 |
16:1 |
100 (14) |
114 (6) |
80 (13) |
26 |
32:1 |
103 (13) |
116 (6), 101(3) |
80 (10) |
20 |
128:1 |
103 (3), 98 (3) |
116 (2), 101 (3), 76 (5) |
80 (7) |
16 |
Ref 32:1 |
105 (14) |
114 (7), 98 (1) |
80 (8) |
NA |
Ref 8:1 |
NA |
NA |
80 (9) |
NA |
Table A6. Stream-averaged snout-vent length (SVL) (mm ± SE) for Eurycea wilderae (Ew)in each of the five treatment streams. Streams were enriched with nutrients from July 2011– July 2013. Hatch represents the mean size of Ew soon after larvae appeared in the streams for that year and Metamorph is the mean body size of a cohort just before metamorphosis and leaving the streams. A given cohort begins with the Hatch date and corresponds to the May in the next calendar year (i.e., Sep 2010 and May 2011 are the same cohort). Parentheses represent the number of individuals captured for that date and stream.
|
Stream (Target Ratio) |
|||||
|
2:1 |
8:1 |
16:1 |
32:1 |
128:1 |
|
Hatch
|
Sep 2010 |
14.5 ± 0.5 (2) |
12.7 ± 0.49 (9) |
13.4 ± 0.54 (10) |
13.1 ± 0.30 (9) |
13.2 ± 0.2 (5) |
July 2011 |
10.3 ± 0.42 (20) |
10.7 ± 0.29 (30) |
9.8 ± 0.33 (34) |
10.2 ± 0.28 (33) |
10.5 ± 0.45 (26) |
|
July 2012 |
12.4 ± 0.21 (20) |
12.0 ± 0.24 (15) |
11.4 ± 0.13 (34) |
11.4 ± 0.08 (52) |
12.1 ± 0.48 (15) |
|
Metamorph |
May 2011 |
12.4 ±1.1 (5) |
13.6 ± 0.65 (17) |
14.4 ± 1.1 (13) |
13.5 ±0.47 (17) |
14.9 ± 1.4 (8) |
May 2012 |
19 (2) |
17.3 ±0.67 (9) |
17.3 ± 0.75 (8) |
17.1 ± 0.21 (40) |
14.8 ± 0.39 (10) |
|
May 2013 |
20.7 ± 0.46 (9) |
19.1 ± 0.88 (4) |
19.4 ± 0.45 (10) |
17.3 ± 0.40 (14) |
17.5 ±1.5 (2) |
|
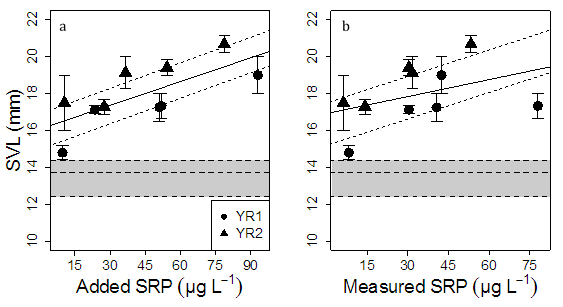
Fig. A1. Average snout-vent length (mm) of Eurycea wilderae in five streams experimentally enriched with nitrogen (N) and phosphorus (P) for two years. Average snout-vent length (SVL) of Ew for YR1 and YR2 of enrichment was positively and significantly correlated with both added (a) and measured (b) soluble reactive phosphorus (SRP) concentration. Values are the average body size of free-roaming larvae captured in May of their respective treatment years just before metamorphosis. Body sizes were different among years (i.e., a year effect) and the dashed regression lines are derived from the parameter estimates for each model while the solid line indicates the overall regression without year as a variable (Table A4 in Appendix). The gray bar represents the range in body size (SVL) measured in May, pre-treatment, just before metamorphosis. The dashed line within the shaded bar is the average pre-treatment SVL across all five streams.