Ecological Archives E096-257-A5
Andrew J. Allstadt, Andrew M. Liebhold, Derek M. Johnson, Robert E. Davis, and Kyle J. Haynes. 2015. Temporal variation in the synchrony of weather and its consequences for spatiotemporal population dynamics. Ecology 96:2935–2946. http://dx.doi.org/10.1890/14-1497.1
Appendix E. Analysis of potential relationships between gypsy moth population synchrony and synchrony in total April, May, and July precipitation.
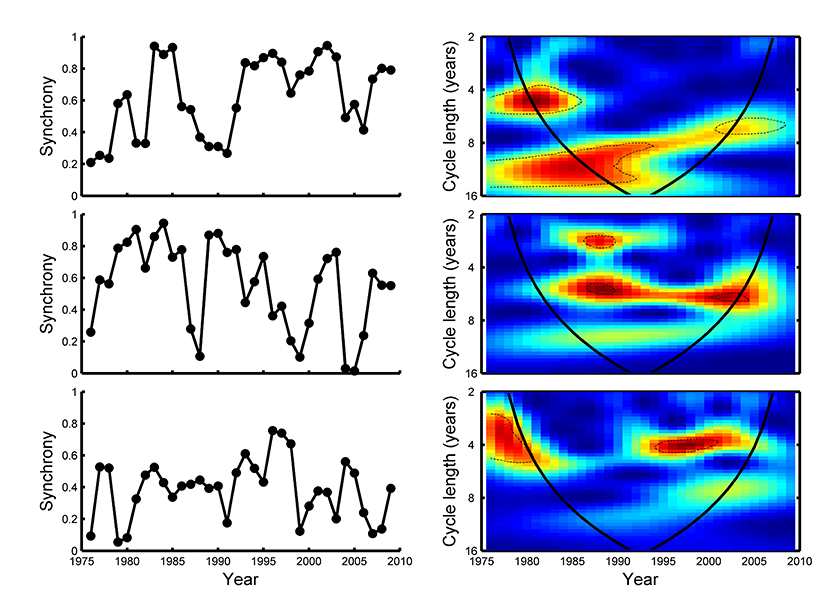
In the main text, we present our finding of a connection between synchrony in gypsy moth outbreaks (SGM) and synchrony in total June precipitation (SJune). Here, we follow the same methods and present results based on April, May, and July precipitation patterns. Synchrony of total precipitation in April, May, and July varied between 0 and 1 (Fig. E1, left side), similar to SJune. Though there was significant periodicity at some cycle lengths (Fig. E1, right side), there was considerably more variation than found in SJune. There was a small area of significant wavelet coherence and cross wavelet power between gypsy moth defoliation synchrony and synchrony in April Precipitation. The other months demonstrated no significant relationships.
Fig. E1. Synchrony time series (left side) and wavelet spectra (right side) for total precipitation in (top) April, (middle) May, and (bottom) July. Red areas within the wavelet spectra indicate higher power, and blue areas denote lower power. Dashed lines indicate areas of the time-scale plane where power significantly higher than expected by chance. Solid, curved lines indicate the cone of influence. Outside of these lines, power values are influenced by the end of the time series and must be interpreted with care (Torrence and Compo 1998).
Fig. E2. Wavelet coherence between synchrony in gypsy moth outbreaks and synchrony in total precipitation in (top) April, (middle) May, and (bottom) July.
Literature cited
Torrence, C., and G. P. Compo. 1998. A practical guide to wavelet analysis. Bulletin of the American Meteorological Society 79:61–78.