Ecological Archives E096-257-A4
Andrew J. Allstadt, Andrew M. Liebhold, Derek M. Johnson, Robert E. Davis, and Kyle J. Haynes. 2015. Temporal variation in the synchrony of weather and its consequences for spatiotemporal population dynamics. Ecology 96:29352946. http://dx.doi.org/10.1890/14-1497.1
Appendix D. Dependence of population synchrony on regional population cycles in partially synchronized populations.
In the simulation model described in the main text, we frequently observed the population synchrony (SP) was higher during rising and falling phases of cycles in regional population density ![]() , and lower during the peaks and troughs of the cycles. As previously noted by Vasseur and Fox (2009) among others, this pattern can be produced when cycles in population densities are not perfectly synchronized. At a peak (or trough) in the regional population cycle, some local populations densities were still rising (falling) while others were already beginning to fall (rise), therefore producing dips in population synchrony coincident with the peak or trough. This pattern can be verified by looking at the distribution, rather than the mean, of the pair-wise correlations among locations at a given time step. During the rising phase most correlations are near 1 (Fig. D1a) while at the peak phase, the density of a given population tends to be positively correlated with some local populations and negatively correlated with others (Fig. D1b). To demonstrate that this is not a statistical artifact caused by our 3-year moving window correlations, we ran simulations with longer cycles in population density (see main text). Population synchrony was still higher during the rising and falling phases of cycles in population density, regardless of the length of the cycle (Fig. D2).
, and lower during the peaks and troughs of the cycles. As previously noted by Vasseur and Fox (2009) among others, this pattern can be produced when cycles in population densities are not perfectly synchronized. At a peak (or trough) in the regional population cycle, some local populations densities were still rising (falling) while others were already beginning to fall (rise), therefore producing dips in population synchrony coincident with the peak or trough. This pattern can be verified by looking at the distribution, rather than the mean, of the pair-wise correlations among locations at a given time step. During the rising phase most correlations are near 1 (Fig. D1a) while at the peak phase, the density of a given population tends to be positively correlated with some local populations and negatively correlated with others (Fig. D1b). To demonstrate that this is not a statistical artifact caused by our 3-year moving window correlations, we ran simulations with longer cycles in population density (see main text). Population synchrony was still higher during the rising and falling phases of cycles in population density, regardless of the length of the cycle (Fig. D2).
Though phase dependence has been previously used to identify conditions promoting an insect outbreak (Jepsen et al. 2009), we found that in our simulations and gypsy moth case study it was generally a nuisance factor. Despite this, we were able to detect more ecologically interesting relationships between environmental synchrony and population synchrony using wavelet analysis.
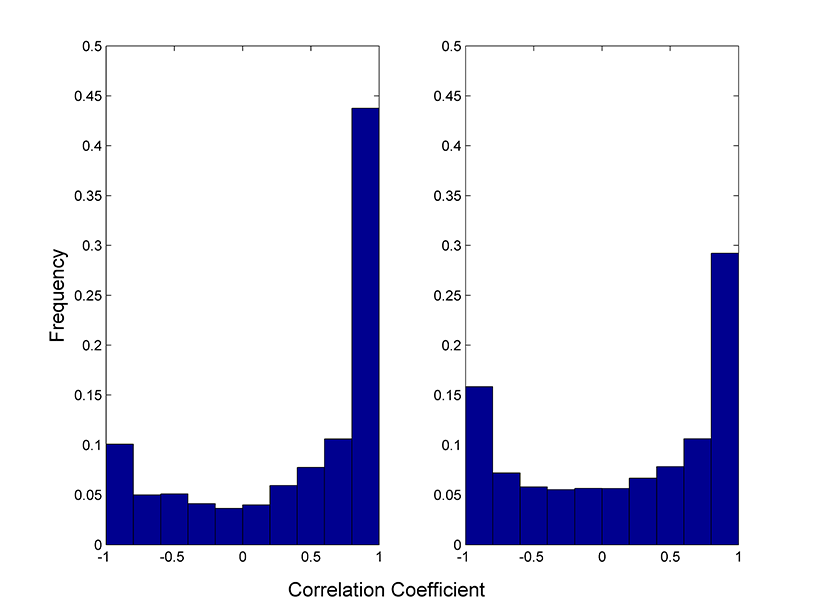
Fig. D1. Distribution of pair-wise correlation coefficients among the 100 simulated local populations during a) the rising phase of an regional population cycle and b) the peak phase of a population cycle. These results are from a simulations with a constant SE = 0.5 and highly periodic local populations (α2 = -0.95) with a 6 year cycle length.
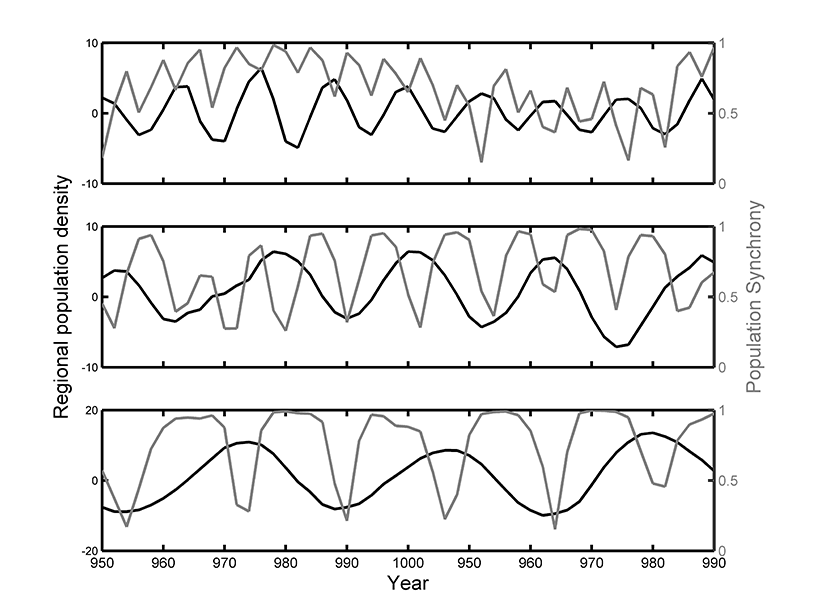
Fig. D2. Simulation results demonstrating the phase dependence of population synchrony (SP) on regional population density with cycle lengths of (top) 6, (middle) 12, and (bottom) 18 years. Local population behavior was highly periodic (α2 = -0.95) and environmental synchrony was constant at SE = 0.5.
Literature cited
Jepsen, J. U., S. B. Hagen, S. R. Karlsen, and R. A. Ims. 2009. Phase-dependent outbreak dynamics of geometrid moth linked to host plant phenology. Proceedings of the Royal Society B: Biological Sciences 276:4119.
Vasseur, D. A., and J. W. Fox. 2009. Phase-locking and environmental fluctuations generate synchrony in a predator-prey community. Nature 460:1007–1010.