Ecological Archives E096-253-A2
Nicholas A. Pardikes, Arthur M. Shapiro, Lee A. Dyer, and Matthew L. Forister. 2015. Global weather and local butterflies: variable responses to a large-scale climate pattern along an elevational gradient. Ecology 96:28912901. http://dx.doi.org/10.1890/15-0661.1
Appendix B. Supplementary figures, including relationships between butterfly abundance and maximum and minimum temperatures, site and species-specific responses to ENSO-derived SSTA for the remaining 22-species not shown in Fig. 3, and relationships between SSTA and local weather (i.e., precipitation, maximum and minimum temperature).
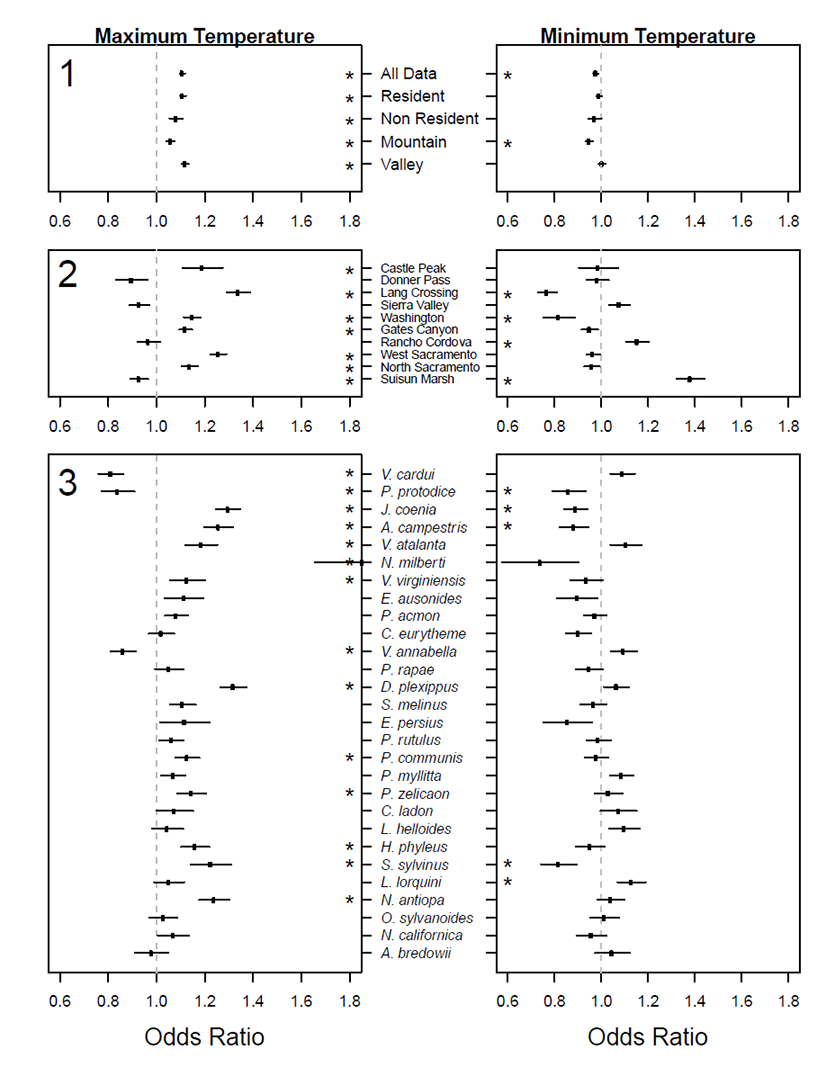
Fig. B1. Odds ratios and standard errors for Maximum Temperature and Minimum Temperature variables included in Models 1–3 from Table 1. Numbers represent the results from each corresponding model. Odds ratios greater than one signify an increase in the probability of attaining an additional positive sighting with each unit increase in z-standardized annual maximum and minimum temperatures. A significant effect on the abundance of butterflies is indicated with an asterisk (*=P<0.05). (1) Each analysis contained identical fixed and random effects, but were performed with different subsets of the data. All Data represents the outcomes from the entire data set (n = 6440). The resident analysis contained 4646 observations, while non-resident data contained 1794 observations. Mountains and Valley analyses had the same number of observations (n = 3220). (2) Results for each site along the elevational gradient. Sites on the y-axis are oriented from lowest (Suisun Marsh) to highest (Castle Peak) elevation. (3) Similar to Figure 2, species in both figures are ordered from highest to lowest SSTA odds ratio.
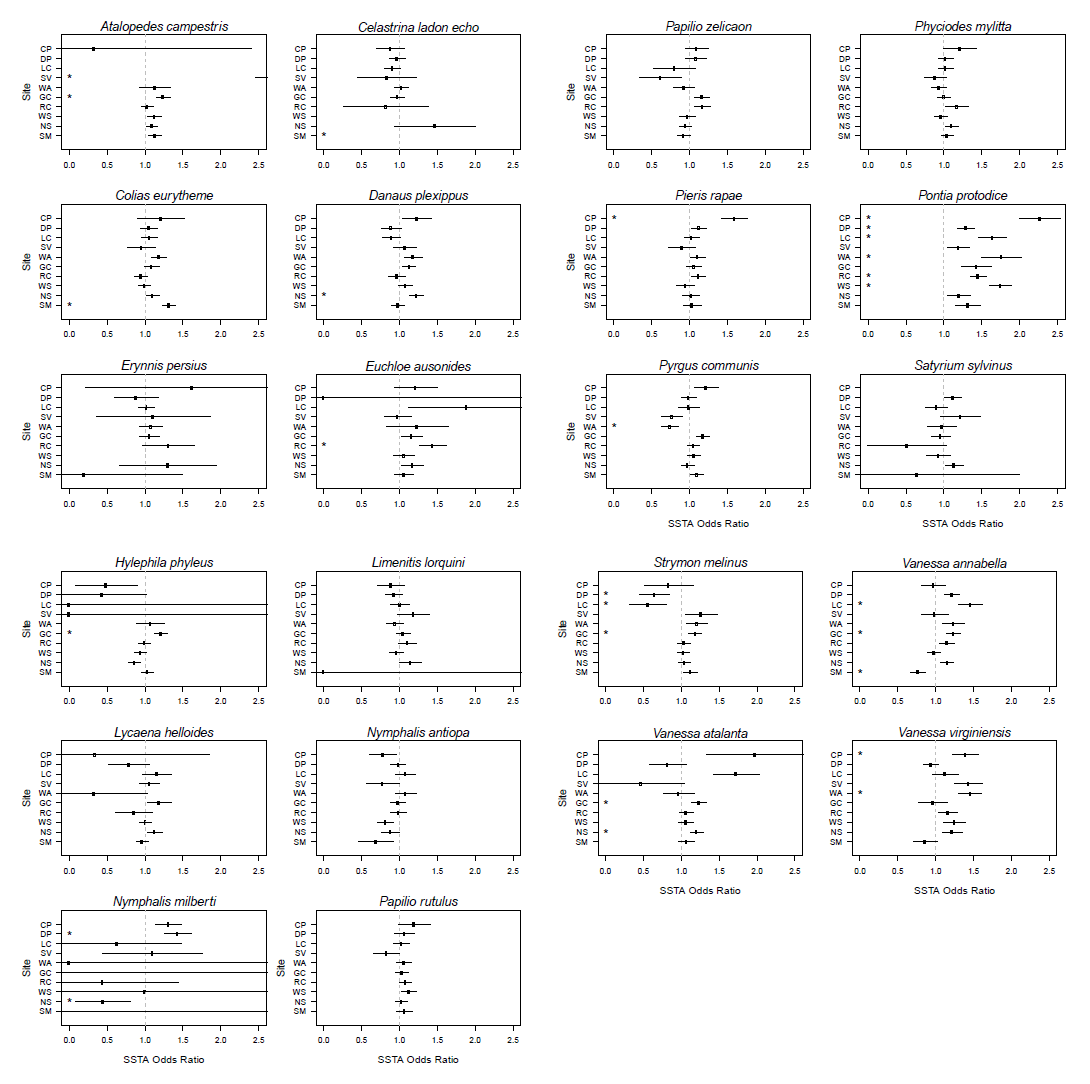
Fig. B2. Odds ratios and standard errors from the fixed-effects logistic regression are displayed for the remaining twenty-two species investigated (Table 1, Model 4). Each species/site combination (n = 280) contained twenty-three years of observational data. Sites on the y-axis are oriented from the lowest (SM) to highest elevation (CP) and site abbreviations are as follows: SM (Suisun Marsh), WS (West Sacramento), NS (North Sacramento), RC (Rancho Cordova), GC (Gates Canyon), WA (Washington), SV (Sierra Valley), LC (Lang Crossing), DP (Donner Pass), and CP (Castle Peak). Some site-specific responses may not be depicted for each species, given that there were several extreme responses to SSTA. Significant effects of ENSO on the abundance of butterflies at each site are indicated with an asterisk (* =P < 0.05).
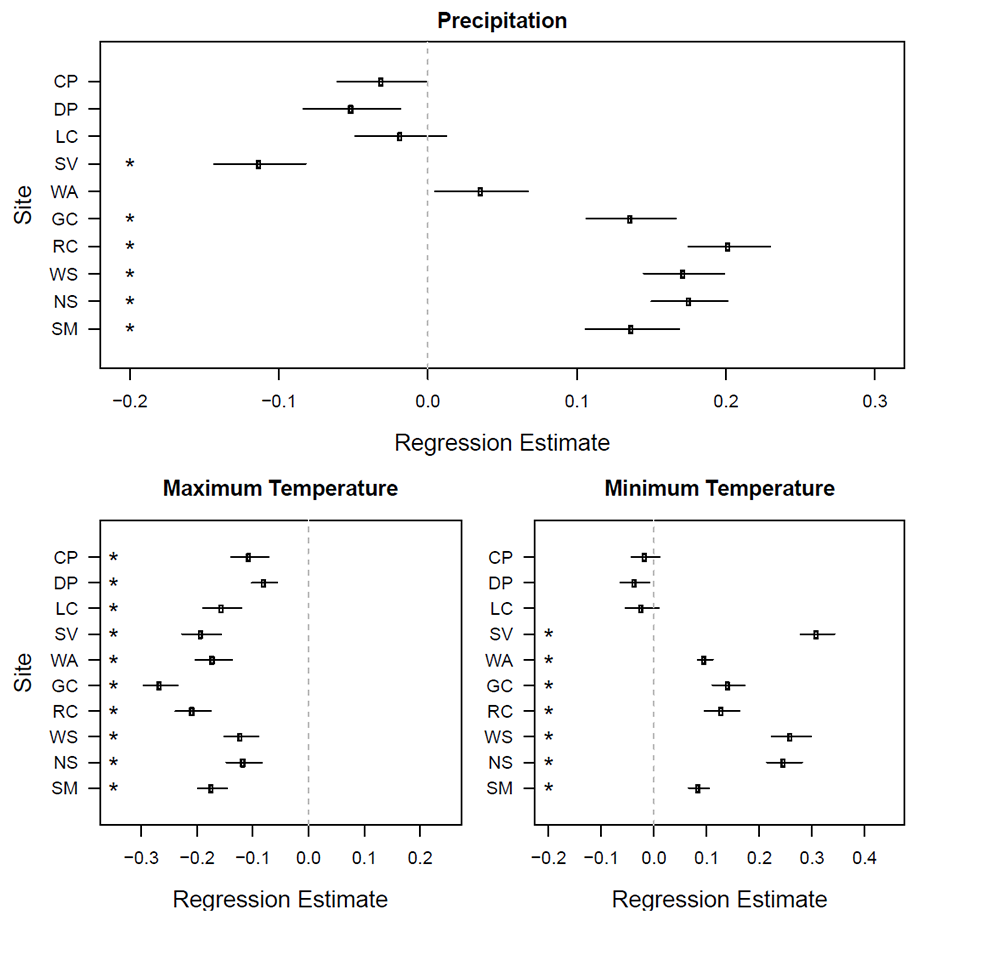
Fig. B3. Reveals the estimates and standard errors of linear regressions between local weather variables (e.g., Precipitation, Maximum Temperature, Minimum Temperature) and SSTA at each of the ten sites used in this analysis. It is important to recognize that the effects of SSTA on local weather vary along the elevational gradient and these relationships differ between the three local weather variables. Sites follow the same abbreviations as Fig. B2.