Ecological Archives E096-251-A1
Jan Karlsson, Ann-Kristin Bergström, Pär Byström, Cristian Gudasz, Patricia Rodríguez, and Catherine Hein. 2015. Terrestrial organic matter input suppresses biomass production in lake ecosystems. Ecology 96:28702876. http://dx.doi.org/10.1890/15-0515.1
Appendix A. Habitat specific CPUE of perch, stable isotopic data of end-members and consumers, and uncertainty in calculations of allochthony of consumers.
Table A1. Average (± 1 SD) catch per unit effort (CPUE) in respectively habitat of perch in biomass (g) and by numbers (#). If no SD is given only one multi mesh gill net was used. n = numbers of age determined perch used to estimate the lake specific size at age function (length = a×age b) and r² = regression coefficients for this function.
Lake |
Littoral |
Profundal |
Pelagic |
|
|
|
(CPUE g/#) |
(CPUE g/#) |
(CPUE g/#) |
n |
r² |
Rengårdstjärnen |
3818 ± 1197 |
1262 ± 315 |
469 ± 309 |
25 |
0.89 |
Holmtjärn |
1827 ± 392 |
1354 ± 196 |
971 ± 392 |
25 |
0.90 |
Snottertjärn |
3508 ± 1630 |
1228 ± 2.5 |
705 ± 811 |
25 |
0.89 |
Lake 4 |
10 ± 14 |
0 |
540 ± 640 |
8 |
0.88 |
Lake 3 |
2274 ± 670 |
1735 |
0 |
11 |
0.89 |
Lilla Björntjärn |
153 ± 26 |
0 |
152 ± 127 |
11 |
0.87 |
Lillsjöliden |
37 |
16.7 |
181.5 |
11 |
0.91 |
Nedre Björntjärn |
0 |
0 |
2810 |
13 |
0.74 |
Övre Björntjärn |
1326 |
0 |
1122 |
14 |
0.82 |
Stortjärn |
700 |
0 |
751 |
16 |
0.38 |
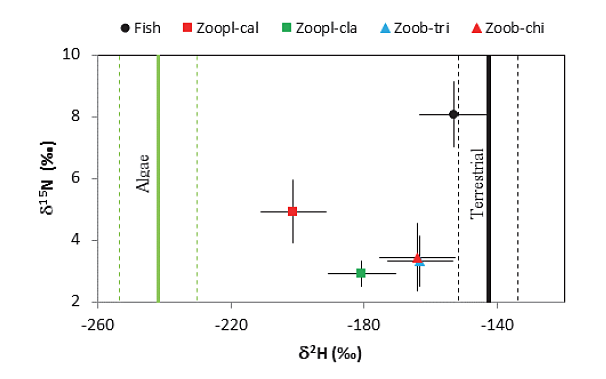
Fig. A1. The stable hydrogen (δ2H) and nitrogen (δ15N) isotopic data (± 1SD) of algae (green line, 9 lakes), terrestrial OC (brown line, 45 sites), zooplankton (Zoopl, 9 lakes), zoobenthos (Zoob, n = 9 lakes) and fish (11 lakes) in the lakes. cal = calanoida, cla = cladoceran, tri = trichopteran, chi = chironomid.
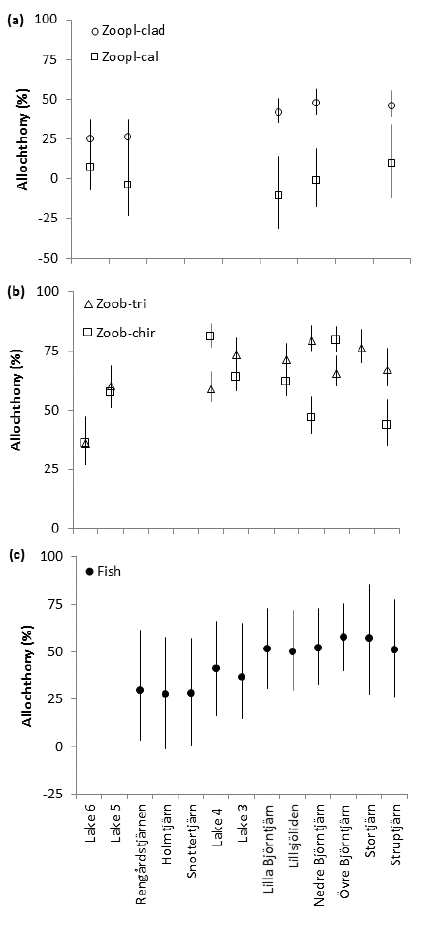
Fig. A2. Uncertainty in allochthony in (a) zooplankton, (b) zoobenthos and (c) fish consumers introduced by assumptions in ΔN (2.8-3.2, Vanderklift and Ponsard 2003) and w (0.10-0.22, Cole et al. 2011) for calculation of wtot (i.e., the total contribution of dietary water to consumer H). The marker represent the calculated mean values used in the paper and the vertical bar show the maximum and minimum values introduced by the assumptions for calculation of wtot.
Literature cited
Cole, J. J., S. R. Carpenter, J. Kitchell, M. L. Pace, C. T. Solomon, and B. Weidel. 2011. Strong evidence for terrestrial support of zooplankton in small lakes based on stable isotopes of carbon, nitrogen, and hydrogen. Proceedings of the National Academy of Sciences 108:1975–1980.
Vanderklift, M. A., and S. Ponsard. 2003. Sources of variation in consumer-diet delta(15)N enrichment: a meta-analysis. Oecologia 136:169-182.