Ecological Archives E096-249-A1
Andrew J. Larson, James A. Lutz, Daniel C. Donato, James A. Freund, Mark E. Swanson, Janneke Hillerislambers, Douglas G. Sprugel, and Jerry F. Franklin. 2015. Spatial aspects of tree mortality strongly differ between young and old-growth forests. Ecology 96:28552861. http://dx.doi.org/10.1890/15-0628.1
Appendix A. Structure, composition, mortality rates, and statistical tests for individual plots.
Table A1. Initial and final stand density and species composition for the study plots.
|
Trees |
|
Density (trees/ha) |
|
Basal area (m²/ha) |
|||
|
Initial sample |
Final sample |
|
Initial sample |
Final sample |
|
Initial sample |
Final sample |
Young forest |
|
|
|
|
|
|
|
|
A1 |
1978 |
2009 |
|
|
|
|
|
|
All trees |
196 |
66 |
|
54,444 |
18,333 |
|
33.9 |
124.7 |
Abies amabilis |
195 |
65 |
|
54,167 |
18,056 |
|
33.6 |
123.9 |
Tsuga heterophylla |
1 |
1 |
|
278 |
278 |
|
0.4 |
0.8 |
A2 |
1978 |
2009 |
|
|
|
|
|
|
All trees |
413 |
91 |
|
114,722 |
25,278 |
|
48.2 |
151.8 |
Abies amabilis |
413 |
91 |
|
114,722 |
25,278 |
|
48.2 |
151.8 |
A3 |
1978 |
2009 |
|
|
|
|
|
|
All trees |
624 |
153 |
|
173,333 |
42,500 |
|
43.2 |
138.6 |
Abies amabilis |
624 |
153 |
|
173,333 |
42,500 |
|
43.2 |
138.6 |
A5 |
1978 |
2009 |
|
|
|
|
|
|
All trees |
531 |
107 |
|
147,500 |
29,722 |
|
42.8 |
117.8 |
Abies amabilis |
531 |
107 |
|
147,500 |
29,722 |
|
42.8 |
117.8 |
A8 |
1978 |
2009 |
|
|
|
|
|
|
All trees |
516 |
124 |
|
143,333 |
34,444 |
|
56.6 |
140.3 |
Abies amabilis |
511 |
120 |
|
141,944 |
33,333 |
|
52.9 |
110.3 |
Tsuga heterophylla |
5 |
4 |
|
1,389 |
1,111 |
|
3.7 |
30.0 |
C2 |
1978 |
2009 |
|
|
|
|
|
|
All trees |
540 |
61 |
|
150,000 |
16,944 |
|
49.8 |
120.7 |
Abies amabilis |
539 |
60 |
|
149,722 |
16,667 |
|
49.6 |
118.2 |
Tsuga heterophylla |
1 |
1 |
|
278 |
278 |
|
0.2 |
2.5 |
C4 |
1978 |
2009 |
|
|
|
|
|
|
All trees |
277 |
95 |
|
76,944 |
26,389 |
|
64.7 |
167.1 |
Abies amabilis |
274 |
93 |
|
76,111 |
25,833 |
|
62.1 |
161.3 |
Thuja plicata |
2 |
1 |
|
556 |
278 |
|
2.1 |
4.7 |
Abies procera |
1 |
1 |
|
278 |
278 |
|
0.5 |
1.0 |
C6 |
1978 |
2009 |
|
|
|
|
|
|
All trees |
310 |
101 |
|
86,111 |
28,056 |
|
41.6 |
149.2 |
Abies amabilis |
308 |
100 |
|
85,556 |
27,778 |
|
40.6 |
139.9 |
Tsuga heterophylla |
2 |
1 |
|
556 |
278 |
|
1.1 |
9.3 |
|
|
|
|
|
|
|
|
|
Old forests |
|
|
|
|
|
|
|
|
AV02 |
1977 |
2008 |
|
|
|
|
|
|
All trees |
334 |
277 |
|
334 |
277 |
|
72.3 |
70.4 |
Abies amabilis |
216 |
175 |
|
216 |
175 |
|
30.1 |
28.7 |
Tsuga heterophylla |
109 |
94 |
|
109 |
94 |
|
33.7 |
34.0 |
Thuja plicata |
5 |
5 |
|
5 |
5 |
|
3.6 |
4.0 |
Pseudotsuga menziesii |
4 |
3 |
|
4 |
3 |
|
4.9 |
3.7 |
AO03 |
1977 |
2008 |
|
|
|
|
|
|
All trees |
246 |
201 |
|
246 |
201 |
|
96.7 |
98.4 |
Abies amabilis |
162 |
128 |
|
162 |
128 |
|
37.4 |
35.8 |
Tsuga heterophylla |
72 |
62 |
|
72 |
62 |
|
22.3 |
25.0 |
Thuja plicata |
9 |
8 |
|
9 |
8 |
|
26.7 |
26.2 |
Pseudotsuga menziesii |
3 |
3 |
|
3 |
3 |
|
10.3 |
11.5 |
AG05 |
1978 |
2008 |
|
|
|
|
|
|
All trees |
421 |
348 |
|
421 |
348 |
|
79.3 |
81.8 |
Abies amabilis |
200 |
148 |
|
200 |
148 |
|
28.6 |
25.1 |
Thuja plicata |
99 |
95 |
|
99 |
95 |
|
22.1 |
26.3 |
Tsuga heterophylla |
81 |
68 |
|
81 |
68 |
|
7.0 |
7.0 |
Taxus brevifolia |
22 |
18 |
|
22 |
18 |
|
0.7 |
0.7 |
Pseudotsuga menziesii |
19 |
19 |
|
19 |
19 |
|
20.9 |
22.8 |
AV06 |
1978 |
2007 |
|
|
|
|
|
|
All trees |
434 |
338 |
|
434 |
338 |
|
45.0 |
46.8 |
Abies amabilis |
271 |
200 |
|
271 |
200 |
|
21.2 |
20.9 |
Tsuga heterophylla |
146 |
123 |
|
146 |
123 |
|
15.9 |
15.7 |
Thuja plicata |
6 |
6 |
|
6 |
6 |
|
2.0 |
2.6 |
Pseudotsuga menziesii |
6 |
6 |
|
6 |
6 |
|
6.5 |
7.1 |
Cupressus nootkatensis |
3 |
3 |
|
3 |
3 |
|
0.4 |
0.6 |
Pinus monticola |
2 |
0 |
|
2 |
0 |
|
0.1 |
0 |
AV14 |
1978 |
2008 |
|
|
|
|
|
|
All trees |
250 |
195 |
|
250 |
195 |
|
69.8 |
60.1 |
Abies amabilis |
132 |
94 |
|
132 |
94 |
|
33.7 |
27.9 |
Tsuga heterophylla |
113 |
98 |
|
113 |
98 |
|
26.4 |
26.7 |
Cupressus nootkatensis |
5 |
3 |
|
5 |
3 |
|
9.8 |
5.5 |
AM16 |
1978 |
2007 |
|
|
|
|
|
|
All trees |
349 |
309 |
|
349 |
309 |
|
60.6 |
60.2 |
Abies amabilis |
148 |
133 |
|
148 |
133 |
|
12.1 |
13.2 |
Cupressus nootkatensis |
113 |
101 |
|
113 |
101 |
|
20.2 |
19.5 |
Tsuga mertensiana |
63 |
52 |
|
63 |
52 |
|
19.0 |
17.8 |
Tsuga heterophylla |
25 |
23 |
|
25 |
23 |
|
9.3 |
9.7 |
AR07 |
1978 |
2007 |
|
|
|
|
|
|
All trees |
423 |
370 |
|
423 |
370 |
|
78.2 |
78.5 |
Cupressus nootkatensis |
158 |
142 |
|
158 |
142 |
|
19.8 |
21.3 |
Abies amabilis |
148 |
113 |
|
148 |
113 |
|
30.6 |
25.7 |
Tsuga mertensiana |
117 |
115 |
|
117 |
115 |
|
27.7 |
31.5 |
AE10 |
1978 |
2007 |
|
|
|
|
|
|
All trees |
616 |
553 |
|
616 |
553 |
|
92.6 |
98.2 |
Cupressus nootkatensis |
322 |
294 |
|
322 |
294 |
|
38.7 |
41.4 |
Abies amabilis |
281 |
250 |
|
281 |
250 |
|
48.3 |
51.3 |
Tsuga mertensiana |
6 |
6 |
|
6 |
6 |
|
2.3 |
2.6 |
Abies lasiocarpa |
5 |
1 |
|
5 |
1 |
|
1.0 |
0.4 |
Abies procera |
2 |
2 |
|
2 |
2 |
|
22.3 |
2.5 |
Table A2. Study duration in years and annualized tree mortality rates for each plot.
Young |
|
Old-growth |
||||
Site |
Duration (yr) |
Mortality (% yr-1) |
|
Site |
Duration (yr) |
Mortality (% yr-1) |
A1 |
31 |
3.48 |
|
AV02 |
31 |
0.60 |
A2 |
31 |
4.69 |
|
AO03 |
31 |
0.65 |
A3 |
31 |
3.85 |
|
AG05 |
30 |
0.63 |
A5 |
31 |
5.03 |
|
AV06 |
29 |
0.86 |
A8 |
31 |
4.53 |
|
AV14 |
30 |
0.82 |
C2 |
31 |
6.78 |
|
AM16 |
29 |
0.42 |
C4 |
31 |
3.33 |
|
AR07 |
29 |
0.46 |
C6 |
31 |
3.63 |
|
AE10 |
29 |
0.37 |
Average |
31 |
4.42 |
|
Average |
29.8 |
0.60 |
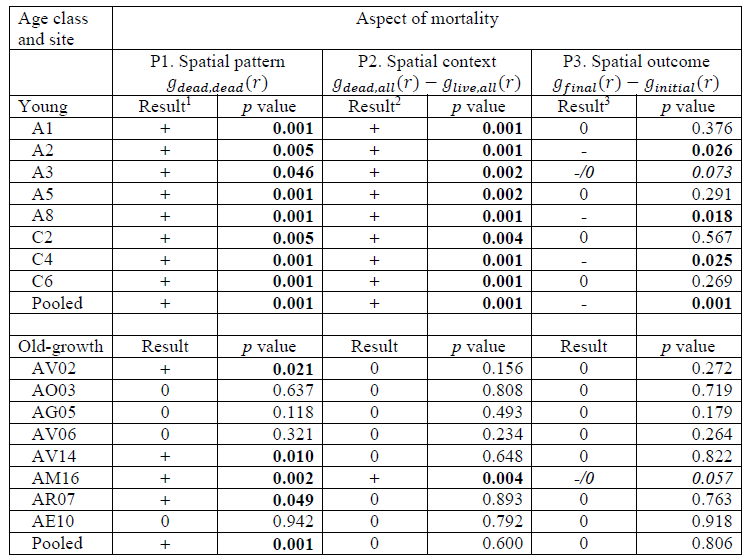
Table A3. Results of Diggle-Cressie-Loosmore-Ford goodness-of-fit tests used to evaluate predictions1-3 listed in Table 1 for individual plots, each of which is based on n = 999 simulations of spatially random mortality (random labeling).
1 Symbols - / 0 / + indicate dead trees are less, not different, or more aggregated (respectively) than expected.
2 Symbols - / 0 / + indicate initial neighborhoods of dying trees are less crowded, do not differ, or are more crowded than initial neighborhoods of surviving trees than expected.
3 Symbols - / 0 / + indicate surviving trees are more uniform, not different, or more aggregated than expected.
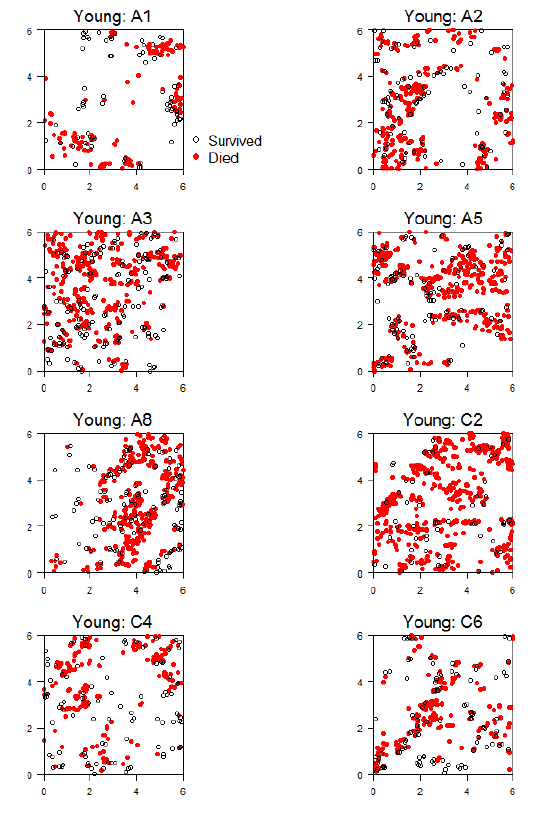
Fig. A1. Stem maps for young plots showing tree locations at study initiation and status (live/dead) at the last census.
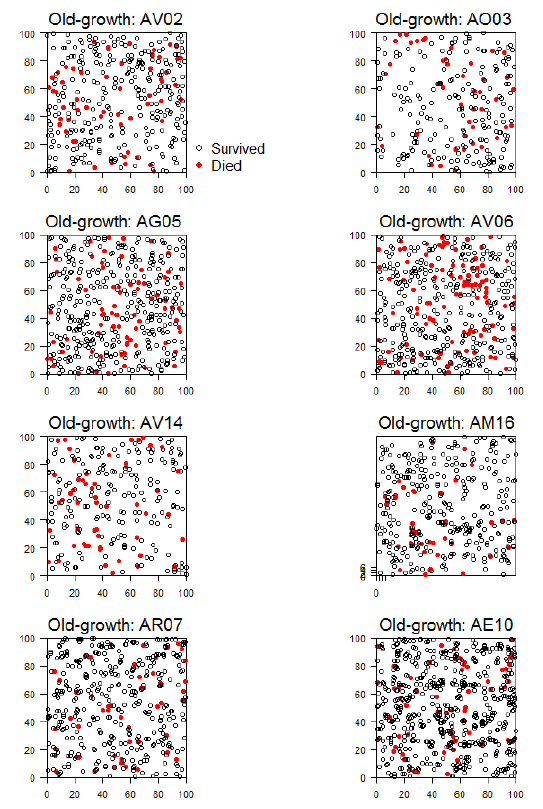
Fig. A2. Stem maps for old-growth plots showing tree locations at study initiation and status (live/dead) at the last census.
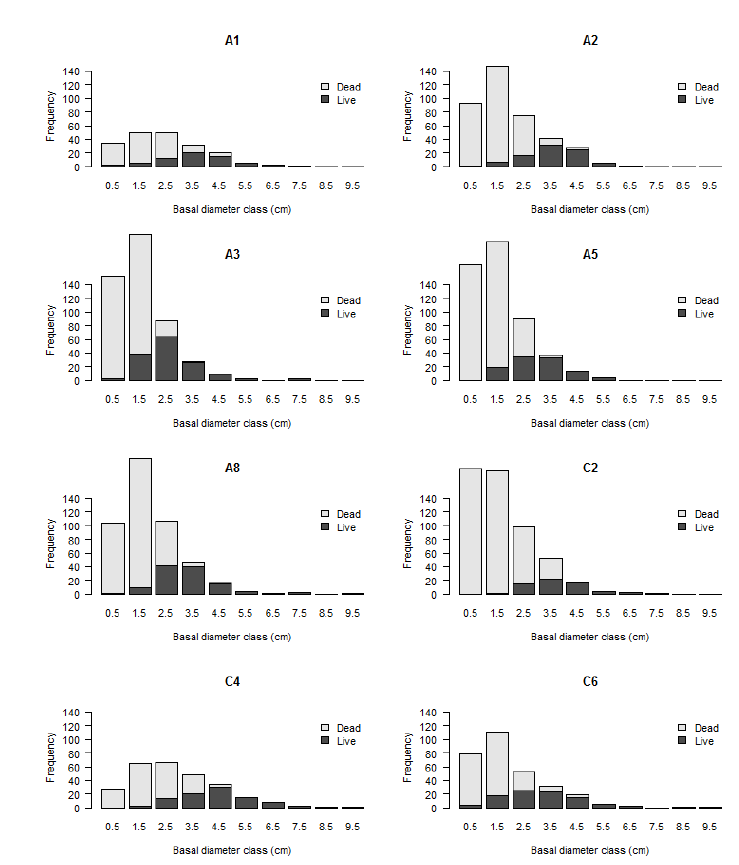
Fig. A3. Diameter distributions (at initial census) for individual young plots showing trees that died and survived during the study.
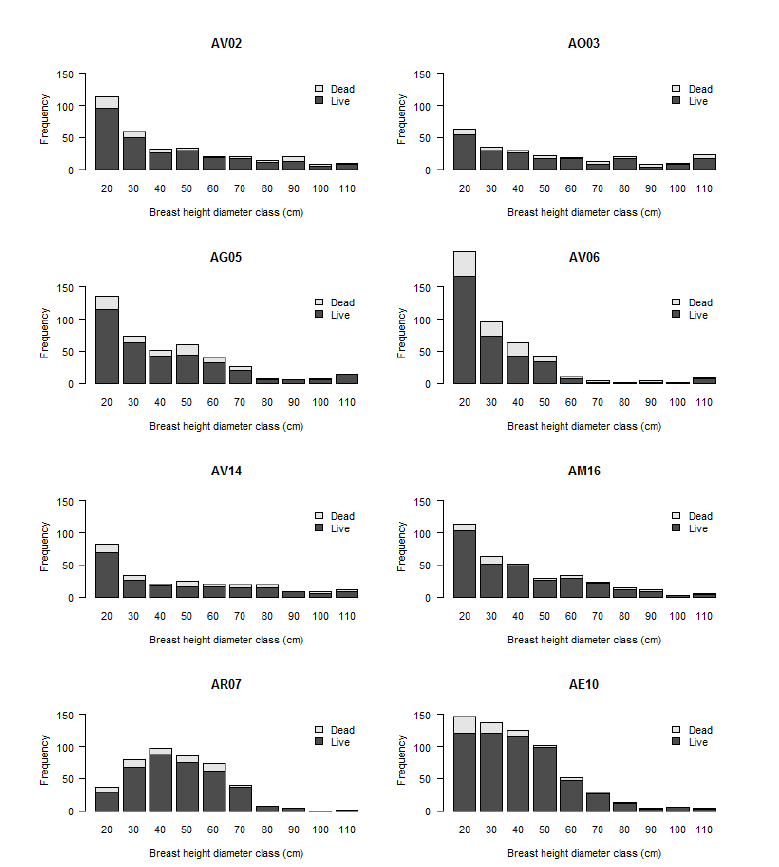
Fig. A4. Diameter distributions (at initial census) for individual old-growth plots showing trees that died and survived during the study. The 110 cm dbh class includes all trees >105 cm dbh, up to the maximum tree dbh of 241.5 cm.