Ecological Archives E096-248-A3
Alastair M. M. Baylis, Rachael A. Orben, John P. Y. Arnould, Fredrik Christiansen, Graeme C. Hays, and Iain J. Staniland. 2015. Disentangling the cause of a catastrophic population decline in a large marine mammal. Ecology 96:28342847. http://dx.doi.org/10.1890/14-1948.1
Appendix C. Details of winter mean sea surface temperatures and sea surface temperature anomalies as a function of time at the Falkland Islands.
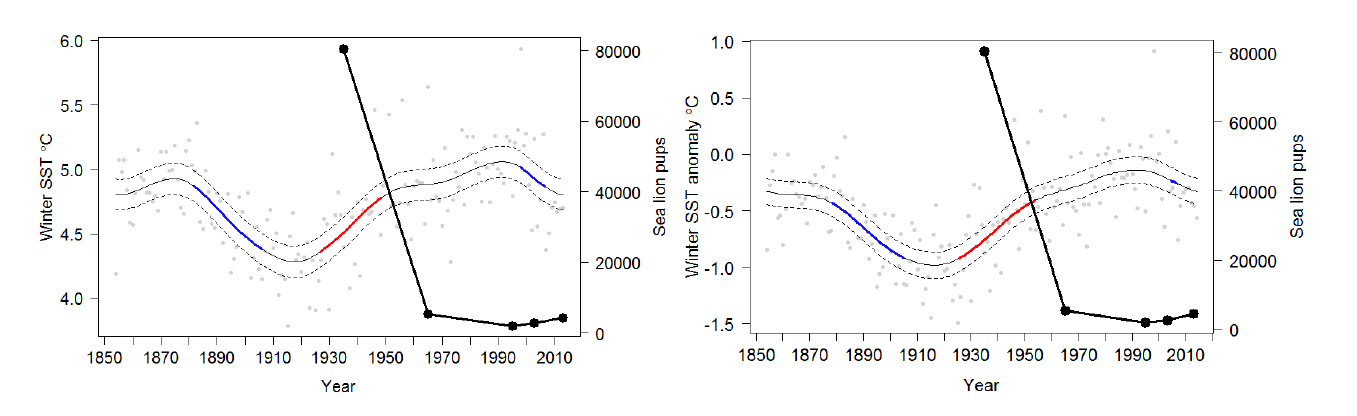
Fig. C1. Winter mean sea surface temperature data and winter SST anomaly (anomaly calculated as deviation from average SST between 1971 and 2000) (SST; mean of June, July and August) as a function of time at the Falkland Islands. The solid gray line represents the fitted smoother (with 95 % pointwise confidence intervals) of the Generalized Additive Model (GAM). Finite differences were used to estimate the rate of change (slope) in the fitted GAM smoother and revealed significant periods of SST decline (blue line) and significant SST increase (red line). The solid black line shows the estimated number of southern sea lion pups at the Falkland Islands from the first census in the 1930s, and subsequent censuses in 1965, 1995, 2003, and 2014 (solid black points). The smoothed line of the GAM is fitted to SST data from the south of the Falkland Islands (58°W- 60°W, 52°S-54°S) (SST: edf = 7.0, F = 7.1, P = <0.001; SST anomaly: edf = 5.8, F = 8.4, P = <0.001).
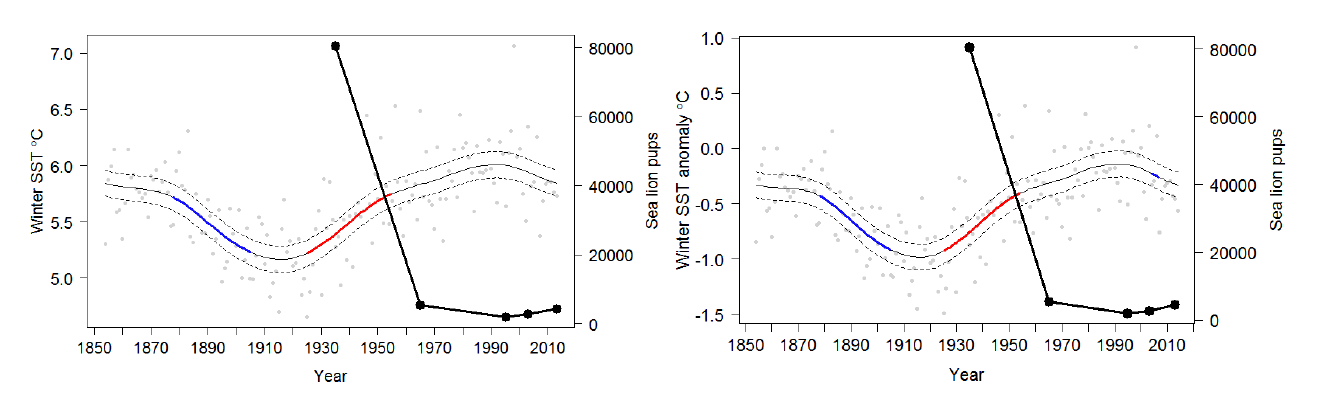
Fig. C2. As above, but for the west of the Falkland Islands (61°W - 63°W, 51°S-53°S) (SST: edf = 5.6, F = 8.4, P = <0.001; SST anomaly: edf = 5.8, F = 8.4, P = <0.001)