Ecological Archives E096-248-A2
Alastair M. M. Baylis, Rachael A. Orben, John P. Y. Arnould, Fredrik Christiansen, Graeme C. Hays, and Iain J. Staniland. 2015. Disentangling the cause of a catastrophic population decline in a large marine mammal. Ecology 96:2834–2847. http://dx.doi.org/10.1890/14-1948.1
Appendix B. Detailed description of the age-class population matrix for the female component of the 1930s Falkland Islands southern sea lion (Otaria flavescens) population and a hypothetical Argentinean population. Also presented is the effect of commercial sealing on population size trajectories (females only) from the population model simulation.
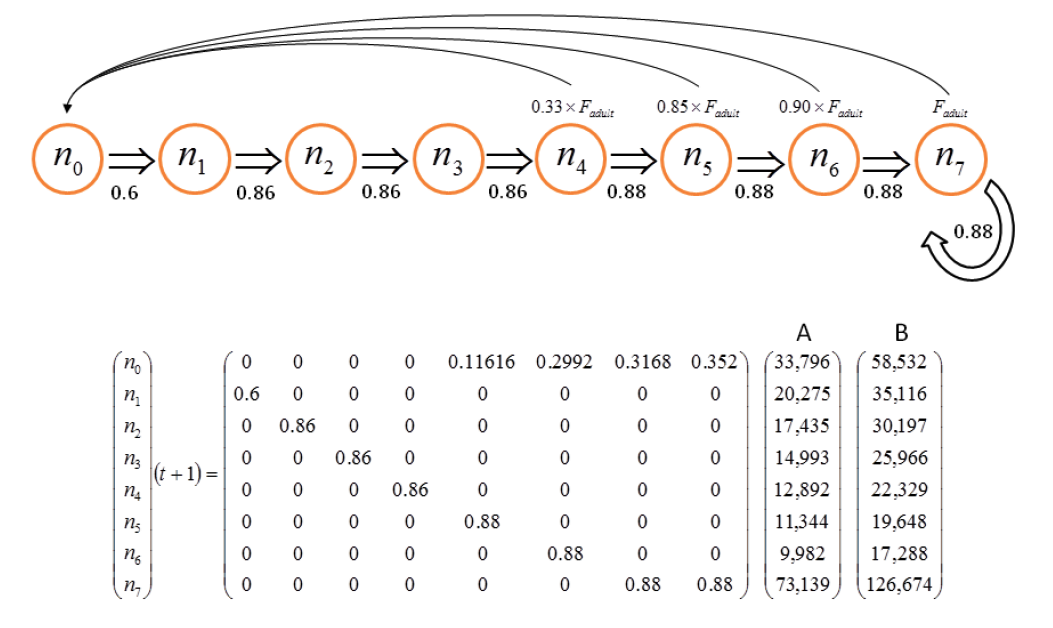
Fig. B1. Life history stages and resulting age-class population matrix for (A) the female component of the 1930s Falkland Islands southern sea lion population, following Thompson et al. (2005) and Branch and Williams (2006) and, (B) the female component of a hypothetical Argentinean population in 1936. A stationary age distribution was first obtained using Fadult = 0.352. Refer to Methods for an explanation of the values used.
Table B1. Estimated total number of southern sea lions in Argentina in 1938. Source: Godoy (1963).
Province in Argentina |
Colony |
Estimated |
Buenos Aires |
Punta Lobos |
20,000 |
Buenos Aires |
Banco Culebra |
20,000* |
Rio Negro |
Punta Bermeja |
18,000 |
Chubut |
Punta Bueno Aures |
15,000 |
Chubut |
Punta Norte |
40,000 |
Chubut |
Punta Delgada |
52,500 |
Chubut |
Punta Ninfas |
12,000 |
Chubut |
Isla Aescondida |
5,000 |
Chubut |
Isla Rasa |
105,000 |
Santa Cruz |
Bahia del Fondo |
20,000 |
Santa Cruz |
Cabo Blanco |
7,000 |
Santa Cruz |
Isla Pinguino |
52,000 |
Santa Cruz |
Loberia Oso Marino |
200,000 |
Santa Cruz |
Monte Leon |
105,000 |
Total |
671,500 |
*number of sea lions estimated in 1937
Table B2. The number of southern sea lions killed in Argentina between 1936 and 1960 (based on the number of skins produced), and used in our population model. Data was not available for individual years. To examine the effect of commercial sealing on our hypothetical Argentinean population, we therefore assumed an equal number of sea lions were killed between 1936–1940, 1941–1945, 1946–1950, 1951–1955 and 1956-1960 because only the total number of skins were reported during these 5-year periods. Source: Godoy (1963) and Thompson et al. (2005).
Year
Sea lions killed
in Argentina1936
46068
1937
46068
1938
46068
1939
46068
1940
46068
1941
30794
1942
30794
1943
30794
1944
30794
1945
30794
1946
11470
1947
11470
1948
11470
1949
11470
1950
11470
1951
2146
1952
2146
1953
2146
1954
2146
1955
2146
1956
1627
1957
1627
1958
1627
1959
1627
1960
1627
Total
460,525
Fig. B2. The effect of commercial sealing on population size trajectories (females only) from the population model simulation for (A) the Falkland Islands population of southern sea lions (1935 – 1965), and (B) a hypothetical Argentinean southern sea lion population (1936 and 1960). The colors and types of the lines correspond to the different age classes (see legend). Refer to text in Methods for an explanation of the population model and commercial sealing data used.
Literature cited
Branch, T., and T. M. Williams. 2006. Legacy of industrial whaling: could killer whales be responsible for declines in Southern Hemisphere sea lions, elephant seals and minke whales? Pages 262–278 in J. A. Estes, D. P. DeMaster, R. L. Brownell, D. F. Doak, and T. Williams, editors. Whales, Whaling and Ocean Ecosystems. University of California Press, Berkeley, California, USA.
Godoy, J. 1963. Fauna Argentina. Consejo Federal de Inversiones. Serie Evaluacibn de 10s Recursos Naturales Renovables 8 (1). Buenos Aires. Page 527 pp.
Thompson, D., I. Strange, M. Riddy, and C. Duck. 2005. The size and status of the population of southern sea lions Otaria flavescens in the Falkland Islands. Biological Conservation 121:357–367.