Ecological Archives E096-246-A3
Florent Mazel, Julien Renaud, François Guilhaumon, David Mouillot, Dominique Gravel, and Wilfried Thuiller. 2015. Mammalian phylogenetic diversity—area relationships at a continental scale. Ecology 96:2814–2822. http://dx.doi.org/10.1890/14-1858.1
Appendix C. Alternative statistical models list and fitting procedure.
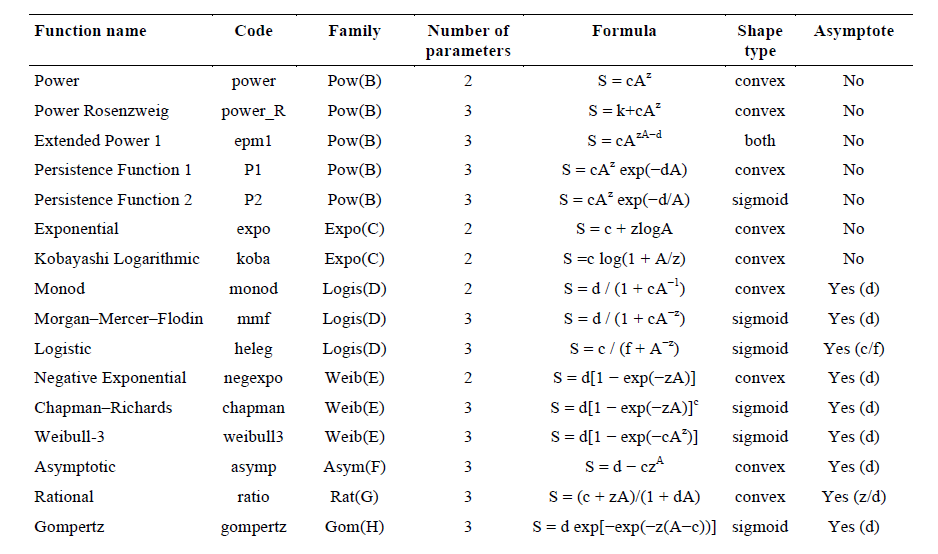
Analytical formula, model shape, and the presence of an asymptote is presented for each function. S= species richness, A= Area, and c, d, f, z= fitted parameters. For the functions with an asymptote, the asymptote’s value is given by the parameter(s) in the last column of the table, i.e., d, c/f, and z/d for the different functions. Note that the shape for the Extended Power 1 can be either convex or sigmoid depending on the fitted parameters.

Here, 16 models were selected to fit SAR and PDAR (see above). Recent attempts to model PDAR only used the power model (Morlon et al. 2011) but, given the uncertainty regarding the shape of PDAR, we tested a large spectrum of models. These models were chosen because they vary in forms (e.g., sigmoid or convex, including asymptotic relationships) and complexity (2 to 4 parameters). We carried out our analyses adding an 'artificial' point of null diversity and null area (0.001 and 0.001 to avoid computing problems). Models were fitted using nonlinear regression with minimization of the residual sum of squares. All analyses were carried out using an updated version of the ‘mmSAR’ package (Guilhaumon et al. 2008) for R statistical and programming environment (R Development Core Team 2014).
For each data set, we discriminated between different models using an information-theory framework designed to evaluate multiple working hypotheses (Burnham and Anderson 1998). The Akaike Information Criterion (AIC) can be used to evaluate the goodness of fit of different non-nested models on a given data set. The weights of evidence were then derived from the AIC values to evaluate the relative likelihood of each model given the data and the set of models (Burnham and Anderson 1998). Using these weights we derived averaged SAR and PDAR derivatives for each continents.
Literature cited
Burnham, K. P., and D. R. Anderson. 1998. Model selection and inference: a practical information-theoretic approach. Page 353 (Editor, Ed.) New York Springer. Springer-Verlag.
Guilhaumon, F., O. Gimenez, K. J. Gaston, and D. Mouillot. 2008. Taxonomic and regional uncertainty in species-area relationships and the identification of richness hotspots. Proceedings of the National Academy of Sciences of the United States of America 105:15458–15463.
Morlon, H., D. W. Schwilk, J. A. Bryant, P. A. Marquet, A. G. Rebelo, C. Tauss, B. J. M. Bohannan, and J. L. Green. 2011. Spatial patterns of phylogenetic diversity. Ecology letters 14:141–149.
Nipperess, D., and F. Matsen. 2013. The mean and variance of phylogenetic diversity under rarefaction. Methods in Ecology and Evolution 4:566–572.
R Development Core Team. 2014. R: A Language and Environment for Statistical Computing. Vienna, Austria.