Ecological Archives E096-237-A3
Tom P. Bregman, Alexander C. Lees, Nathalie Seddon, Hannah E. A. Macgregor, Bianca Darski, Alexandre Aleixo, Michael B. Bonsall, and Joseph A. Tobias. 2015. Species interactions regulate the collapse of biodiversity and ecosystem function in tropical forest fragments. Ecology 96:26922704. http://dx.doi.org/10.1890/14-1731.1
Appendix C. Supplementary results with tables showing functional trait Principal Components and additional model results.
Table C1. Principal Component Analysis (PCA) for insectivores. Eigenvalues and the proportion of variance explained are presented. PC1 for locomotory and trophic traits were used in a second PCA to create an axis representing overall size. PC2 for locomotory and trophic traits represented variation of these syndromes independent of body size, and was used in further analysis.
PCA |
PC |
Proportion variance |
PCA loadings |
|||
Locomotory |
|
|
Tarsus length |
Tail length |
Wing chord |
|
1 |
0.734 |
–0.529 |
–0.569 |
–0.630 |
||
2 |
0.198 |
0.779 |
–0.620 |
–0.095 |
||
Trophic |
|
|
Beak length |
Beak width |
Beak depth |
|
1 |
0.785 |
–0.526 |
–0.594 |
–0.608 |
||
2 |
0.162 |
0.845 |
–0.446 |
–0.669 |
||
Overall size |
|
|
Trophic PC1 |
Locomotory PC1 |
||
1 |
0.858 |
0.707 |
0.707 |
|||
Table C2. Principal Component Analysis (PCA) for frugivores. Eigenvalues and the proportion of variance explained are presented. PC1 for locomotory and trophic traits were used in a second PCA to create an axis representing overall body size. PC2 for locomotory and trophic traits represented variation of these syndromes independent of body size, and was used in further analysis.
PCA |
PC |
Proportion variance |
PCA loadings |
|||
Locomotory |
|
|
Tarsus length |
Tail length |
Wing chord |
|
1 |
0.797 |
0.514 |
0.583 |
0.628 |
||
2 |
0.179 |
–0.821 |
0.546 |
0.165 |
||
Trophic |
|
|
Beak length |
Beak width |
Beak depth |
|
1 |
0.897 |
0.566 |
0.588 |
0.578 |
||
2 |
0.070 |
–0.802 |
0.229 |
0.776 |
||
Overall size |
|
|
Trophic PC1 |
Locomotory PC1 |
||
1 |
0.804 |
–0.707 |
–0.707 |
|||
Table C3. Phylogenetic signal of trait axes using Blomberg’s K. K values close to 1 indicate a Brownian motion model of trait evolution whilst a value of 0 indicates a random model of trait evolution.
Guild |
Trait |
K |
P |
Insectivores |
Locomotory |
0.59 |
<0.001 |
Trophic |
0.54 |
<0.001 |
|
Dispersal |
0.62 |
<0.001 |
|
Overall size |
1.38 |
<0.001 |
|
Frugivores |
Locomotory |
1.11 |
<0.001 |
Trophic |
0.53 |
<0.001 |
|
Dispersal |
0.71 |
<0.001 |
|
Overall size |
0.47 |
<0.001 |
Table C4. Average fixed effect estimates derived from the top linear models, <2AICc from the best fitting model. Standardized estimates for community assembly metrics were used as the response variable and environmental variables as the fixed effects. FS, Fragment size (ha); GF, Percentage of fragment covered in good quality forest; D, Distance of fragment away from nearest forest >1000 ha.
Guild |
Trait syndrome |
Metric |
Variable |
Estimate (SE) |
Z value |
P value |
Insectivores |
Phylogeny |
MNTD |
FS |
–0.580 (0.143) |
4.047 |
<0.001 |
Locomotory |
SDNDr |
GF |
0.496 (0.381) |
1.247 |
0.212 |
|
FS |
0.516 (0.367) |
1.345 |
0.179 |
|||
D |
–0.490 (0.380) |
1.239 |
0.215 |
|||
Variance |
GF |
–0.357 (0.315) |
1.083 |
0.279 |
||
FS |
–0.354 (0.315) |
1.074 |
0.283 |
|||
D |
0.218 (0.320) |
0.653 |
0.514 |
|||
Dispersal |
SDNDr |
GF |
0.564 (0.329) |
1.637 |
0.102 |
|
FS |
0.377 (0.339) |
1.063 |
0.288 |
|||
Variance |
D |
–0.952 (0.539) |
1.700 |
0.089 |
||
FS |
–0.859 (0.455) |
1.827 |
0.067 |
|||
D*FS |
0.683 (0.621) |
1.048 |
0.295 |
|||
Foraging |
SDNDr |
D |
–0.920 (0.555) |
1.615 |
0.106 |
|
FS |
–0.678 (0.402) |
1.608 |
0.108 |
|||
D*FS |
0.68 (0.61) |
1.059 |
0.290 |
|||
Variance |
D |
–0.297 (0.432) |
1.099 |
0.272 |
||
FS |
–0.852 (0.393) |
2.087 |
0.037 |
|||
Overall size |
SDNDr |
FS |
0.884 (0.335) |
2.533 |
0.011 |
|
GF |
0.384 (0.351) |
1.042 |
0.297 |
|||
Variance |
FS |
–0.297 (0.131) |
2.271 |
0.031 |
||
Frugivores |
Phylogeny |
MNTD |
D |
0.673 (0.496) |
1.296 |
0.195 |
FS |
1.111 (0.517) |
2.083 |
0.037 |
|||
GF |
–0.487 (0.398) |
0.417 |
0.243 |
|||
FS*GF |
–2.013 (0.802) |
2.392 |
0.017 |
|||
Locomotory |
SDNDr |
D |
–0.266 (0.239) |
1.063 |
0.288 |
|
FS |
0.255 (0.240) |
1.017 |
0.309 |
|||
Variance |
GF |
0.060 (0.250) |
0.241 |
0.811 |
||
Dispersal |
SDNDr |
D |
–1.752 (0.844) |
1.998 |
0.046 |
|
FS |
0.577 (0.467) |
1.178 |
0.239 |
|||
GF |
–0.900 (0.505) |
1.692 |
0.091 |
|||
D*FS |
2.364 (0.755) |
2.987 |
0.003 |
|||
D*GF |
2.252 (1.300) |
1.644 |
0.100 |
|||
Variance |
D |
0.816 (0.402) |
1.950 |
0.051 |
||
GF |
0.469 (0.431) |
1.040 |
0.298 |
|||
Foraging |
SDNDr |
D |
0.879 (0.874) |
0.963 |
0.336 |
|
FS |
1.212 (0.509) |
2.271 |
0.023 |
|||
GF |
–0.778 (0.527) |
1.402 |
0.161 |
|||
D*FS |
–2.455 (0.878) |
2.678 |
0.007 |
|||
FS*GF |
–2.729 (1.193) |
2.172 |
0.030 |
|||
Variance |
FS |
–1.032 (0.318) |
3.113 |
0.002 |
||
GF |
0.273 (0.345) |
0.756 |
0.450 |
|||
Overall |
SDNDr |
D |
–0.531 (0.389) |
1.316 |
0.188 |
|
GF |
–0.494 (0.397) |
1.201 |
0.230 |
|||
Variance |
D |
–0.176 (0.340) |
0.498 |
0.618 |
||
FS |
0.048 (0.333) |
0.346 |
0.890 |
|||
GF |
0.505 (0.296) |
1.633 |
0.103 |
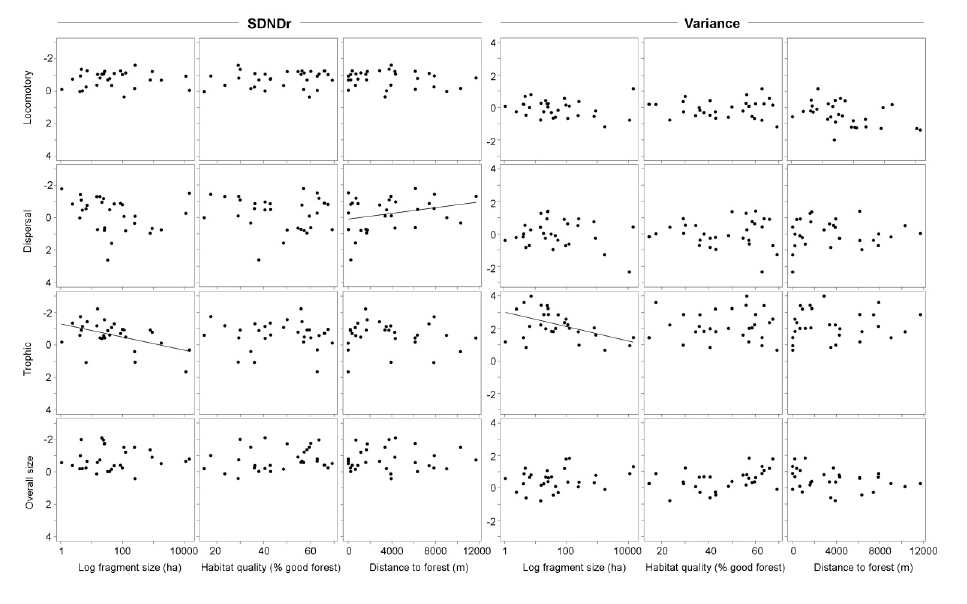
Fig. C1. Structure of insectivore communities (n = 30) in fragments with different habitat characteristics. Regression lines are shown for significant relationships (derived from top model sets), and represent the fit of a model with individual habitat variables as the sole predictor of the structuring metrics. Final model outputs are included in Table C4.
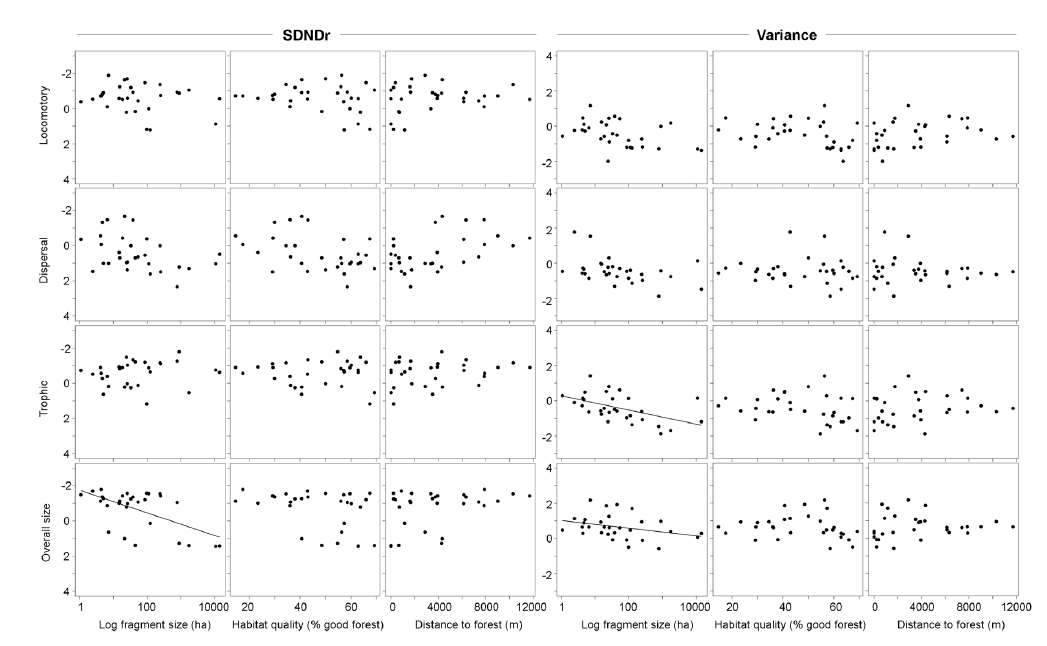
Fig. C2. Structure of frugivore communities (n = 30) in fragments with different habitat characteristics. Regression lines are shown for significant relationships (derived from top model sets), and represent the fit of a model with individual habitat variables as the sole predictor of the structuring metrics. Final model outputs are included in Table C4.
Table C5. Community structure in assemblages of avian insectivores surviving in tropical forest fragments (n = 30). Asterisks (*) indicate observed values for community structure metrics (MNTD, SDNDr, variance) significantly different from the null model in the direction providing evidence for competitive interactions (variance is predicted to be greater than expected; SDNDr is predicted to be lower than expected). The standardized effect size (SES) is provided along with the standard error (SE). Statistics (V) and P values are from Wilcoxon signed rank tests (two-tailed). Using an arbitrary 50:50 threshold, we ran analyses separately for 15 ‘small’ and 15 ‘large’ fragments (see Methods).
|
|
Small patch size |
Large patch size |
||||||
Metric |
Trait syndrome |
SES (mean + SE) |
No. plots < expectation |
V |
P |
SES (mean + SE) |
No. plots < expectation |
V |
P |
MNTD |
Phylogeny |
0.662 (0.938) |
3 |
20 |
0.022* |
–0.461 (0.663) |
11 |
101 |
0.018 |
SDNDr |
Locomotory |
–0.562 (0.676) |
14 |
119 |
<0.001 |
–0.122 (1.070) |
10 |
92 |
0.037 |
Trophic |
–0.240 (0.702) |
11 |
108 |
0.002 |
–0.173 (0.950) |
11 |
102 |
0.008 |
|
Dispersal |
0.137 (1.007) |
7 |
58 |
0.555 |
0.366 (0.834) |
4 |
22 |
0.987 |
|
Overall |
–0.785 (0.938) |
13 |
115 |
<0.001 |
–0.241 (0.895) |
9 |
92 |
0.037 |
|
Variance |
Locomotory |
0.112 (0.915) |
9 |
77 |
0.359 |
–0.163 (0.794) |
12 |
103 |
0.012 |
Trophic |
0.270 (0.888) |
8 |
69 |
0.639 |
–0.337 (0.814) |
11 |
104 |
0.010 |
|
Dispersal |
0.228 (0.924) |
12 |
87 |
0.135 |
–0.331 (0.644) |
14 |
119 |
<0.001 |
|
Overall |
0.586 (0.610) |
0 |
0 |
<0.001* |
–0.041 (0.794) |
5 |
26 |
0.055 |
|
Table C6. Community structure in assemblages of avian frugivores surviving in tropical forest fragments (n = 30). Asterisks (*) indicate observed values for community structure metrics (MNTD, SDNDr, variance) significantly different from the null model in the direction providing evidence for competitive interactions (variance is predicted to be greater than expected; SDNDr is predicted to be lower than expected). The standardized effect size (SES) is provided along with the standard error (SE). Statistics (V) and P-values are from Wilcoxon signed rank tests (two-tailed). Using an arbitrary 50:50 threshold, we ran analyses separately for 15 ‘small’ and 15 ‘large’ fragments (see Methods).
|
|
Small patch size |
Large patch size |
||||||
Metric |
Trait syndrome |
SES (mean + SE) |
No. plots < expectation |
V |
P |
SES (mean + SE) |
No. plots < expectation |
V |
P |
MNTD |
Phylogeny |
–0.464 (0.972) |
9 |
99 |
0.026 |
0.363 (0.829) |
4 |
31 |
0.107 |
SDNDr |
Locomotory |
–0.381 (0.585) |
14 |
119 |
<0.001 |
–0.114 (0.696) |
14 |
117 |
<0.001 |
Trophic |
–0.556 (0.889) |
14 |
110 |
0.001 |
0.302 (1.515) |
11 |
93 |
0.032 |
|
Dispersal |
–0.482 (0.848) |
11 |
109 |
0.002 |
0.177 (1.104) |
8 |
58 |
0.555 |
|
Overall |
–0.608 (0.899) |
14 |
119 |
<0.001 |
–0.063 (0.707) |
14 |
111 |
0.001 |
|
Variance |
Locomotory |
0.137 (0.547) |
5 |
45 |
0.421 |
–0.226 (0.735) |
10 |
90 |
0.095 |
Trophic |
1.222 (0.886) |
0 |
0 |
<0.001* |
0.293 (0.794) |
0 |
0 |
<0.001* |
|
Dispersal |
0.126 (0.828) |
7 |
45 |
0.421 |
–0.344 (1.138) |
9 |
70 |
0.600 |
|
Overall |
–0.073 (0.673) |
3 |
18 |
0.015* |
0.015 (0.876) |
3 |
17 |
0.012* |
|
Table C7. Community structure in assemblages of avian insectivores surviving in tropical forest fragments (n = 30). Asterisks (*) indicate observed values for community structure metrics (SDNDr, variance) significantly different from the null model in the direction providing evidence for competitive interactions (variance is predicted to be greater than expected; SDNDr is predicted to be lower than expected). The standardized effect size (SES) is provided along with the standard error (SE). Statistics (V) and P values are from Wilcoxon signed rank tests (two-tailed). Using an arbitrary 50:50 threshold, we ran analyses separately for the 15 ‘least isolated’ fragments (i.e., closest to forests >1000 ha) and the 15 ‘most isolated’ fragments (i.e., nearest to forests >1000 ha).
|
|
Least isolated patches |
Most isolated patches |
||||||
Metric |
Trait syndrome |
SES (mean + SE) |
No. plots < expectation |
V |
P |
SES (mean + SE) |
No. plots < expectation |
V |
P |
MNTD |
Phylogeny |
0.057 (0.302) |
8 |
119 |
0.806 |
0.144 (0.203) |
6 |
113 |
1 |
SDNDr |
Locomotory |
–0.213 (0.667) |
14 |
118 |
<0.001 |
–0.282 (0.646) |
14 |
119 |
<0.001 |
Trophic |
–0.158 (1.582) |
13 |
111 |
0.001 |
–0.095 (0.987) |
12 |
98 |
0.015 |
|
Dispersal |
0.175 (1.187) |
8 |
58 |
0.555 |
–0.480 (0.730) |
11 |
106 |
0.003 |
|
Overall |
–0.329 (0.748) |
15 |
120 |
<0.001 |
–0.342 (0.952) |
13 |
114 |
<0.001 |
|
Variance |
Locomotory |
–0.033 (0.776) |
7 |
68 |
0.679 |
–0.056 (0.556) |
8 |
66 |
0.762 |
Trophic |
0.821 (1.012) |
0 |
0 |
<0.001* |
0.694 (0.881) |
0 |
0 |
<0.001* |
|
Dispersal |
–0.071 (1.241) |
7 |
46 |
0.454 |
–0.147 (0.746) |
9 |
69 |
0.639 |
|
Overall |
0.190 (0.804) |
2 |
7 |
<0.001* |
–0.249 (0.690) |
4 |
27 |
0.064 |
|
Table C8. Community structure in assemblages of avian frugivores surviving in tropical forest fragments (n = 30). Asterisks (*) indicate observed values for community structure metrics (SDNDr, variance) significantly different from the null model in the direction providing evidence for competitive interactions (variance is predicted to be greater than expected; SDNDr is predicted to be lower than expected). The standardized effect size (SES) is provided along with the standard error (SE). Statistics (V) and P values are from Wilcoxon signed rank tests (two-tailed). Using an arbitrary 50:50 threshold, we ran analyses separately for the 15 ‘least isolated’ fragments (i.e., closest to forests >1000 ha) and the 15 ‘most isolated’ fragments (i.e., nearest to forests >1000 ha).
|
|
Least isolated patches |
Most isolated patches |
||||||
Metric |
Trait syndrome |
SES (mean + SE) |
No. plots < expectation |
V |
Wilcoxen P |
SES (mean + SE) |
No. plots < expectation |
V |
Wilcoxen P |
|
Phylogeny |
0.089 (0.257) |
5 |
114 |
0.964 |
–0.190 (0.254) |
8 |
138 |
0.304 |
SDNDr |
Locomotory |
0.023 (1.246) |
9 |
92 |
0.037 |
–0.464 (0.416) |
15 |
120 |
<0.001 |
Trophic |
–0.020 (0.886) |
10 |
96 |
0.021 |
–0.392 (0.734) |
12 |
112 |
0.001 |
|
Dispersal |
0.661 (0.720) |
2 |
4 |
1 |
–0.158 (0.928) |
9 |
80 |
0.138 |
|
Overall |
–0.262 (0.977) |
9 |
88 |
0.060 |
–0.765 (0.865) |
13 |
117 |
<0.001 |
|
Variance |
Locomotory |
–0.170 (1.011) |
11 |
96 |
0.041 |
0.119 (0.663) |
10 |
84 |
0.188 |
Trophic |
–0.077 (1.031) |
10 |
86 |
0.151 |
0.009 (0.763) |
9 |
87 |
0.135 |
|
Dispersal |
0.175 (1.084) |
11 |
82 |
0.229 |
–0.278 (0.390) |
15 |
120 |
<0.001 |
|
Overall |
0.160 (0.974) |
4 |
22 |
0.030* |
0.385 (0.488) |
1 |
1 |
<0.001* |
|
Table C9. Community structure in assemblages of avian insectivores surviving in tropical forest fragments (n = 30). Asterisks (*) indicate observed values for community structure metrics (SDNDr, variance) significantly different from the null model in the direction providing evidence for competitive interactions (variance is predicted to be greater than expected; SDNDr is predicted to be lower than expected). The standardized effect size (SES) is provided along with the standard error (SE). Statistics (V) and P values are from Wilcoxon signed rank tests (two-tailed). Using an arbitrary 50:50 threshold, we ran analyses separately for 15 ‘high quality’ and 15 ‘low quality’ fragments (see Methods).
|
|
High quality patches |
Low quality patches |
||||||
Metric |
Trait syndrome |
SES (mean + SE) |
No. plots < expectation |
V |
P |
SES (mean + SE) |
No. plots < expectation |
V |
P |
|
Phylogeny |
–0.666 (0.244) |
8 |
114 |
0.967 |
0.267 (0.264) |
6 |
112 |
1 |
SDNDr |
Locomotory |
–0.238 (0.613) |
14 |
119 |
<0.001 |
–0.258 (0.700) |
14 |
117 |
<0.001 |
Trophic |
–0.222 (1.017) |
12 |
102 |
0.008 |
–0.032 (1.557) |
13 |
108 |
0.002 |
|
Dispersal |
–0.190 (1.116) |
11 |
91 |
0.042 |
–0.115 (0.960) |
8 |
69 |
0.319 |
|
Overall |
–0.127 (0.929) |
13 |
111 |
0.001 |
–0.545 (0.714) |
15 |
120 |
<0.001 |
|
Variance |
Locomotory |
–0.174 (0.577) |
10 |
81 |
0.252 |
0.086 (0.736) |
5 |
51 |
0.639 |
Trophic |
0.783 (0.859) |
0 |
0 |
<0.001* |
0.732 (1.034) |
0 |
0 |
<0.001* |
|
Dispersal |
–0.230 (0.598) |
10 |
77 |
0.359 |
0.012 (1.307) |
6 |
42 |
0.330 |
|
Overall |
–0.350 (0.681) |
5 |
38 |
0.229 |
0.292 (0.735) |
1 |
1 |
<0.001* |
|
Table C10. Community structure in assemblages of avian frugivores surviving in tropical forest fragments (n = 30). Asterisks (*) indicate observed values for community structure metrics (SDNDr, variance) significantly different from the null model in the direction providing evidence for competitive interactions (variance is predicted to be greater than expected; SDNDr is predicted to be lower than expected). The standardized effect size (SES) is provided along with the standard error (SE). Statistics (V) and P values are from Wilcoxon signed rank tests (two-tailed). Using an arbitrary 50:50 threshold, we ran analyses separately for 15 ‘high quality’ and 15 ‘low quality’ fragments (see Methods).
|
|
High quality patches |
Low quality patches |
||||||
Metric |
Trait syndrome |
SES (mean + SE) |
No. plots < expectation |
V |
P |
SES (mean + SE) |
No. plots < expectation |
V |
P |
|
Phylogeny |
0.060 (0.259) |
5 |
120 |
0.775 |
–0.160 (0.254) |
8 |
139 |
0.285 |
SDNDr |
Locomotory |
–0.431 (0.540) |
14 |
119 |
<0.001 |
–0.010 (1.211) |
10 |
94 |
0.028 |
Trophic |
–0.240 (0.748) |
11 |
108 |
0.002 |
–0.172 (0.914) |
11 |
102 |
0.008 |
|
Dispersal |
–0.112 (0.987) |
9 |
72 |
0.262 |
0.615 (0.693) |
2 |
13 |
0.998 |
|
Overall |
–0.755 (0.959) |
13 |
114 |
<0.001 |
–0.271 (0.891) |
9 |
91 |
0.042 |
|
Variance |
Locomotory |
0.137 (0.576) |
10 |
81 |
0.252 |
–0.188 (1.058) |
11 |
96 |
0.041 |
Trophic |
0.126 (0.625) |
9 |
84 |
0.188 |
–0.193 (1.097) |
10 |
84 |
0.188 |
|
Dispersal |
–0.092 (0.820) |
14 |
105 |
0.008 |
–0.011 (0.872) |
12 |
96 |
0.041 |
|
Overall |
0.450 (0.650) |
2 |
17 |
<0.001* |
0.095 (0.851) |
3 |
17 |
0.012* |
|
Table C11. Variance Inflation Factor (VIF) for each of the continuous predictor variables used in the GLMs. A VIF threshold of >4 (or >10) is used as a rule of thumb for excessive multicollinearity in regression analyses (O’Brien 2007).
Variable |
Variance Inflation Factor (VIF) |
Fragment size |
2.033 |
Habitat quality (% of good forest) |
1.515 |
Distance to forest |
2.296 |
Table C12. Mantel test for GLMs assessing spatial correlation in functional trait syndromes across our study site.
Guild |
Metric |
Trait syndrome |
Monte-Carlo test observed value |
P value |
Insectivore |
SDNDr |
Locomotory |
0.072 |
0.245 |
Trophic |
–0.083 |
0.796 |
||
Dispersal |
–0.112 |
0.892 |
||
Overall |
–0.068 |
0.696 |
||
Variance |
Locomotory |
0.074 |
0.222 |
|
Trophic |
–0.076 |
0.771 |
||
Dispersal |
–0.124 |
0.845 |
||
Overall |
0.028 |
0.367 |
||
Frugivore |
SDNDr |
Locomotory |
–0.029 |
0.635 |
Trophic |
0.013 |
0.402 |
||
Dispersal |
0.192 |
0.077 |
||
Overall |
0.011 |
0.386 |
||
Variance |
Locomotory |
–0.026 |
0.577 |
|
Trophic |
–0.011 |
0.524 |
||
Dispersal |
0.103 |
0.162 |
||
Overall |
0.013 |
0.542 |
Literature cited
O’Brien, R.M. 2007, A caution regarding rules of thumb for Variance Inflation Factors, Quality and Quantity 41:673–690.