Ecological Archives E096-233-A4
Connor R. Fitzpatrick, Anurag A. Agrawal, Nathan Basiliko, Amy P. Hastings, Marney E. Isaac, Michael Preston, and Marc T. J. Johnson. 2015. The importance of plant genotype and contemporary evolution for terrestrial ecosystem processes. Ecology 96:26322642. http://dx.doi.org/10.1890/14-2333.1
Appendix D. Correlations between measured O. biennis traits and ecosystem processes, and a figure showing the genotypic correlation between substrate induced respiration and two leaf chemical traits.
Table D1. Correlations between measured O. biennis traits and ecosystem processes. We measured pairwise genetic correlations as the Pearson product moment correlation coefficient (r) by correlating genotype means of ecosystem process rates against corresponding trait data. Significant correlations were relatively few, which might be explained by the fact that we measured the traits and ecosystem variables from different experiments in different years, albeit at the same field site. Abbreviations are as follows: ET – ellagitannin, SLA – specific leaf area, SIR – substrate induced respiration. Flowering strategy explains whether a plant was annual or biennial. Flowering date was the number of days until the first flower emerged and bolt date was the number of days until a plant started to bolt. The measurement of other traits, including the concentrations of individual metabolites are described in Johnson et al. (2009).
|
SIR (μg CO2 g soil-1 h-1) |
Seedling Performance (mg) |
Leaf decay - field (decay constant k) |
||||
r |
P value |
r |
P value |
r |
P value |
||
Fruits |
0.19 |
0.48 |
-0.39 |
0.11 |
0.15 |
0.58 |
|
Damage (proportion) |
-0.07 |
0.80 |
-0.15 |
0.56 |
0.21 |
0.44 |
|
Biomass |
0.34 |
0.20 |
-0.23 |
0.36 |
0.19 |
0.49 |
|
Flowering date |
-0.05 |
0.86 |
0.13 |
0.60 |
-0.36 |
0.17 |
|
Flowering strategy |
0.12 |
0.65 |
-0.40 |
0.10 |
0.06 |
0.84 |
|
Bolt days |
-0.03 |
0.90 |
0.30 |
0.22 |
-0.31 |
0.24 |
|
C:N |
0.23 |
0.40 |
-0.25 |
0.32 |
0.25 |
0.36 |
|
Trichomes |
0.34 |
0.20 |
0.29 |
0.24 |
0.28 |
0.29 |
|
SLA |
-0.17 |
0.53 |
0.28 |
0.26 |
-0.22 |
0.42 |
|
Water content |
0.26 |
0.32 |
-0.15 |
0.55 |
-0.14 |
0.62 |
|
Chlorogenic acid |
-0.60 |
0.01** |
-0.12 |
0.65 |
-0.10 |
0.71 |
|
ET 1 |
-0.16 |
0.57 |
-0.12 |
0.63 |
-0.32 |
0.22 |
|
ET 2 |
0.14 |
0.61 |
-0.30 |
0.23 |
-0.21 |
0.43 |
|
ET 3 |
0.33 |
0.22 |
0.03 |
0.91 |
-0.11 |
0.70 |
|
ET 4 |
0.07 |
0.81 |
-0.11 |
0.67 |
0.09 |
0.75 |
|
ET 5 |
-0.09 |
0.74 |
-0.12 |
0.65 |
0.05 |
0.86 |
|
Oenothein A |
0.03 |
0.92 |
-0.11 |
0.66 |
0.08 |
0.78 |
|
ET 6 |
0.13 |
0.64 |
-0.44 |
0.07 |
-0.20 |
0.46 |
|
ET other |
-0.22 |
0.41 |
-0.19 |
0.45 |
0.05 |
0.86 |
|
ET total |
0.11 |
0.69 |
-0.50 |
0.03* |
-0.14 |
0.62 |
|
Flavanoid 1 |
-0.19 |
0.47 |
0.19 |
0.45 |
-0.13 |
0.64 |
|
Flavanoid 2 |
-0.37 |
0.15 |
0.20 |
0.43 |
-0.21 |
0.44 |
|
Flavanoid 3 |
0.33 |
0.21 |
-0.42 |
0.08 |
0.24 |
0.38 |
|
Flavanoid 4 |
0.11 |
0.68 |
-0.47 |
0.05* |
0.33 |
0.21 |
|
Flavanoid other |
0.13 |
0.63 |
0.08 |
0.74 |
0.38 |
0.14 |
|
Flavanoid total |
0.15 |
0.57 |
-0.24 |
0.33 |
0.17 |
0.54 |
|
Total phenolics |
0.12 |
0.65 |
-0.43 |
0.07 |
-0.06 |
0.81 |
|
SIR |
1.00 |
NA |
0.36 |
0.17 |
0.28 |
0.34 |
|
Seedling performance |
0.36 |
0.17 |
1.00 |
NA |
0.35 |
0.18 |
|
Leaf decay |
0.28 |
0.34 |
0.35 |
0.18 |
1.00 |
NA |
|
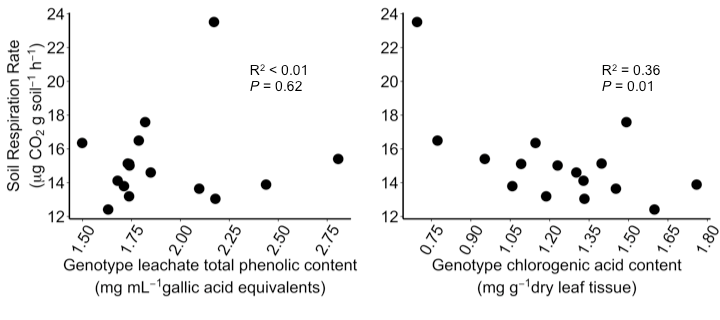
Fig. D1. Genotypic correlation of substrate induced respiration rates vs. (A) phenolic content of leachates, and (B) chlorogenic acid concentration. Each point represents the genotype mean of induced soil respiration rate and the corresponding genotype mean for phenolic content and chlorogenic acid content.