Ecological Archives E096-229-A2
Christoffer Moesgaard Albertsen, Kim Whoriskey, David Yurkowski, Anders Nielsen, and Joanna Mills Flemming. 2015. Fast fitting of non-Gaussian state-space models to animal movement data via Template Model Builder. Ecology 96:25982604. http://dx.doi.org/10.1890/14-2101.1
Appendix B. Detailed description of the applications.
The subadult and adult ringed seal were captured near Sanikiluaq, Nunavut, Canada at 56°32'34''N 079°13'30''W on 19 October 2010 and 30 October 2011, respectively, and attached with an ARGOS satellite-relayed data logger manufactured by Sea Mammal Research Unit, University of St. Andres, Scotland, UK (see Fedak et al. 1983 for the method used).
For the adult and subadult data, we applied TMB-g, TMB-t, bsam, and crawl to estimate the unobserved tracks. During data collection, Argos tags can sometimes record multiple observations with the same time stamp. These observations are assumed to be independent given the states in both our TMB and the bsam model implementations. However, non-unique time steps are not permitted when using crawl, thus only the first observation listed with a non-unique time stamp is used. The crawl package uses simulated annealing and was run with a maximum of 300 iterations. The bsam package was set to use time steps of 1/8 of a day (corresponding to an average of 2.6 and 1.5 observations per estimated state respectively), an adaption and burn-in period of 40,000, and to generate 20,000 samples thereafter.
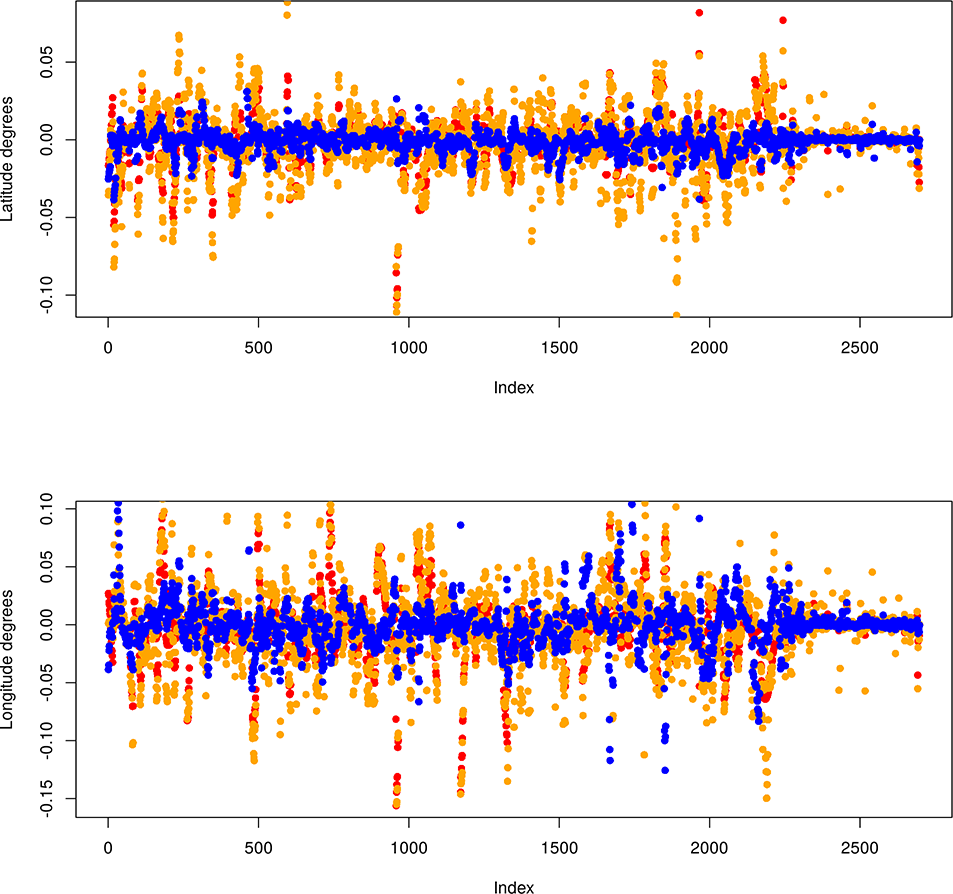
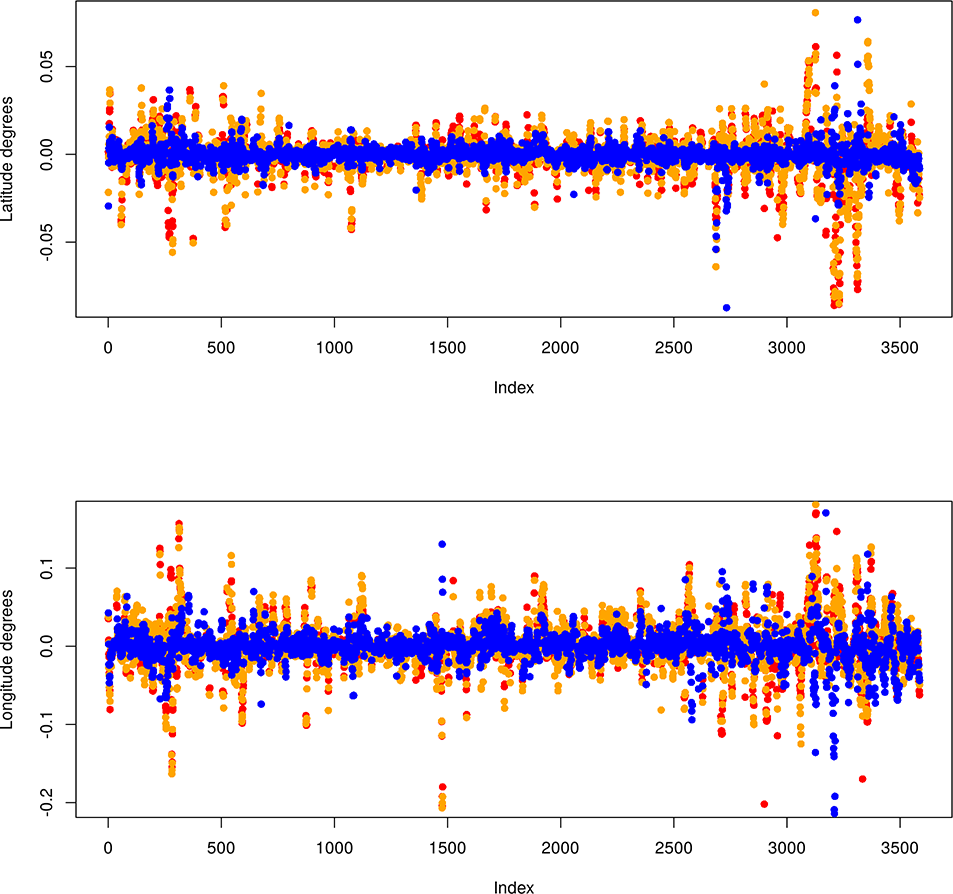
Figures B1 and B2 shows the difference in coordinate degrees between the TMB-g implementation and the other models for the subadult and adult data respectively. The values for crawl are closer to zero than for the other models. Further, it can be seen that the values for TMB-t and bsam are close to each other.
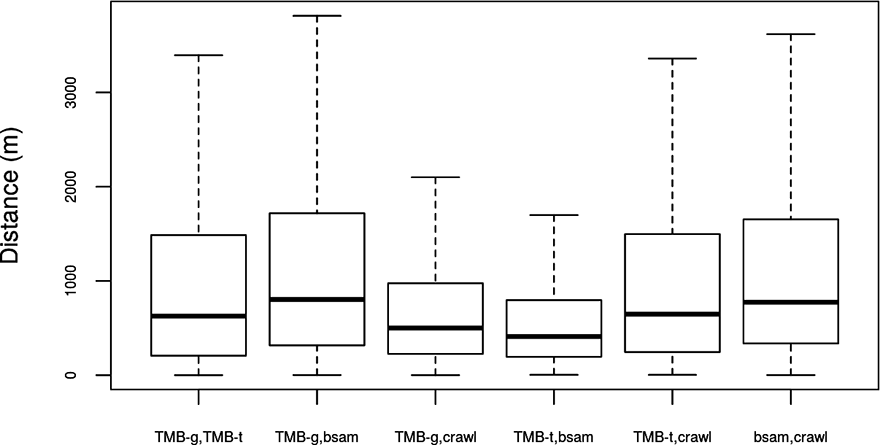
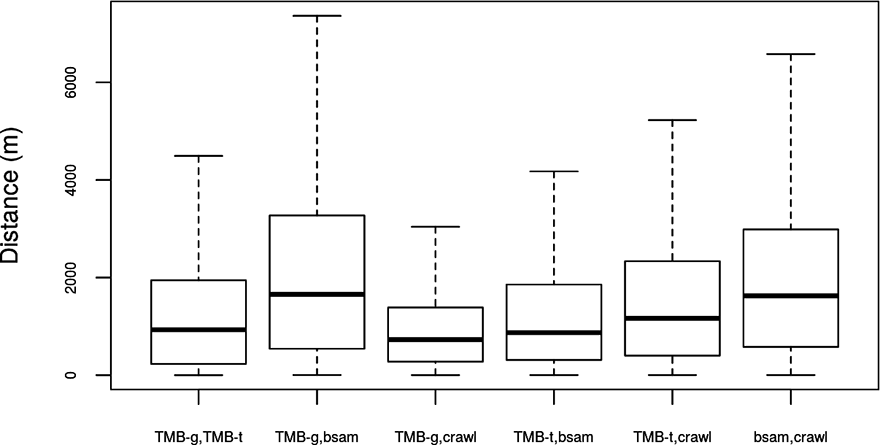
Tables B1–B4 shows the correlation between the estimated locations from the four model implementations. All correlations are close to one, but crawl is most correlated with TMB-g (and vice versa) and bsam is most correlated with TMB-t (and vice versa). Figure B3 and B4 depicts a summary of the distributions of distances between estimated locations between the models. Again it is evident that all model fits are very similar, yet the implementations with the same measurement error distributions are more similar to each other than to the other implementations.
Table B1. Sample correlation between estimated latitude locations for the subadult ringed seal data.
| TMB-g | TMB-t | bsam | crawl | |
|---|---|---|---|---|
| TMB-g | 1.0000000 | 0.9999698 | 0.9999687 | 0.9999906 |
| TMB-t | 0.9999698 | 1.0000000 | 0.9999916 | 0.9999617 |
| bsam | 0.9999687 | 0.9999916 | 1.0000000 | 0.9999612 |
| crawl | 0.9999906 | 0.9999617 | 0.9999612 | 1.0000000 |
Table B2. Sample correlation between estimated longitude locations for the subadult ringed seal data.
| TMB-g | TMB-t | bsam | crawl | |
|---|---|---|---|---|
| TMB-g | 1.0000000 | 0.9998428 | 0.9998180 | 0.9999043 |
| TMB-t | 0.9998428 | 1.0000000 | 0.9999568 | 0.9997511 |
| bsam | 0.9998180 | 0.9999568 | 1.0000000 | 0.9997323 |
| crawl | 0.9999043 | 0.9997511 | 0.9997323 | 1.0000000 |
Table B3. Sample correlation between estimated latitude locations for the adult ringed seal data.
| TMB-g | TMB-t | bsam | crawl | |
|---|---|---|---|---|
| TMB-g | 1.0000000 | 0.9987975 | 0.9975026 | 0.9996689 |
| TMB-t | 0.9987975 | 1.0000000 | 0.9988938 | 0.9986778 |
| bsam | 0.9975026 | 0.9988938 | 1.0000000 | 0.9979340 |
| crawl | 0.9996689 | 0.9986778 | 0.9979340 | 1.0000000 |
Table B4. Sample correlation between estimated longitude locations for the adult ringed seal data.
| TMB-g | TMB-t | bsam | crawl | |
|---|---|---|---|---|
| TMB-g | 1.0000000 | 0.9998347 | 0.9996671 | 0.9999028 |
| TMB-t | 0.9998347 | 1.0000000 | 0.9998701 | 0.9997347 |
| bsam | 0.9996671 | 0.9998701 | 1.0000000 | 0.9996541 |
| crawl | 0.9999028 | 0.9997347 | 0.9996541 | 1.0000000 |
Fig. B1. Difference between estimated locations of TMB-g and TMB-t (red), bsam (orange), and crawl (blue) in latitude and longitude for the subadult ringed seal data.
Fig. B2. Difference between estimated locations of TMB-g and TMB-t (red), bsam (orange), and crawl (blue) in latitude and longitude for the adult ringed seal data.
Fig. B3. Distance in meters between estimated locations for the models at each time point for the subadult data.
Fig. B4. Distance in meters between estimated locations for the models at each time point for the adult data.
LITERATURE CITED
Fedak, M. A., S. S. Anderson, and M. G. Curry. 1983. Attachment of a radio tag to the fur of seals. Journal of Zoology 200:298–300.